Share this page


This topic describe how to define a performance test using the Performance Test Designer.
Performance Test Designer - workflow
This section provides a workflow for using the Performance Test Designer.
-
Open the Performance Test Designer
-
In the LoadRunner Enterprise masthead, click the module name or the dropdown arrow and select Test Management.
-
In the test management tree:
-
For a new test:
Select a folder in which you want to create a test or create a new folder, and click New Test
 . Follow the steps in Create a test.
-
For an existing test:
Select a performance test in the test management tree and click Edit Test.
-
-
-
Define a test
Use the following tabs in the Performance Test Designer to define your performance test:
Groups and Workload Use the Groups and Workload tab to design a workload for the test, which includes selecting a Controller for the test, scripts to run in the test, load generators on which to run the Vusers, and scheduling how many Vusers to run in each script and for how long to run them.
For details, see View test summary and Manage groups and workloads.
Assets Use the Assets tab to select monitors to monitor the test, and use customized analysis templates to display your performance test run reports.
For details, see Monitors and Analysis templates.
SLA Use the SLA tab to define service level agreements (SLAs) to measure performance metrics against performance goals.
For details, see Define service level agreements (SLAs).
Disruption Events Use the Disruption Events tab to add disruption events from chaos engineering platforms to your performance tests. These events provide simulated attacks on your services and environments.
For details, see Chaos testing.
-
Click Save Test to save changes in each tab, or Save and Run to save and then run the test. The Run Test dialog box opens, enabling you to run the test. For details, see Run a test.
When you save the test, it goes through a validation process. If the test is not valid or there are notifications about the test, click the Test validation results
 icon (next to the Save Test button) to open the Test Validation Results dialog box which lists errors, warnings, and informational messages related to the test.
 Note: If you make changes to the test, and the test is linked to a timeslot, the timeslot is updated with these changes automatically.

View test summary
You can get general summary information about the test from the General details pane in the Groups and Workload tab.

User interface elements are described below:
|
UI Elements |
Description |
|---|---|
| Validation |
Indicates whether the test is valid.
If the test is not valid or there are notifications about the test, click the Test validation results |
| Workload Type |
Displays the workload type for the test. Click the dropdown to open the Workload Types dialog box and select a type of workload for the test. For details, see Vuser distribution methods. Note: Not available for Goal-Oriented schedule. |
| Total Vusers |
Displays the total number of Vusers distributed to all of the Vuser groups participating in the test. Note:
For details, see Distribute Vusers among Vuser groups. |
| Number of Groups |
The number of scripts selected to run in the test (a Vuser group is created for each script). For details, see Create groups and distribute Vusers. |
| Controller |
Displays the Controller type selected for the test: Dedicated or a specific host Controller. Click the dropdown to modify this setting. For details, see Select a Controller. |
| Load Generator |
Displays the number of hosts selected for the test, and their properties. For details, see Distribute load generators among Vuser groups. |
| Trending |
Indicates whether LoadRunner Enterprise is configured to automatically publish trend results (Yes/No). Click the dropdown to open the Trend Settings dialog box and configure trending settings. For details, see Configure automatic trending from the user interface. |
| Assigned Test Set |
Displays the number of test sets selected for the test. Click the dropdown to view or modify this setting. For more details, see Create, edit, or assign a test set. |
 Indicates that there is an error in the test design.
 Indicates that the test is valid and can run.
Manage groups and workloads
You configure groups and test workloads from the Groups and Group Details panes.
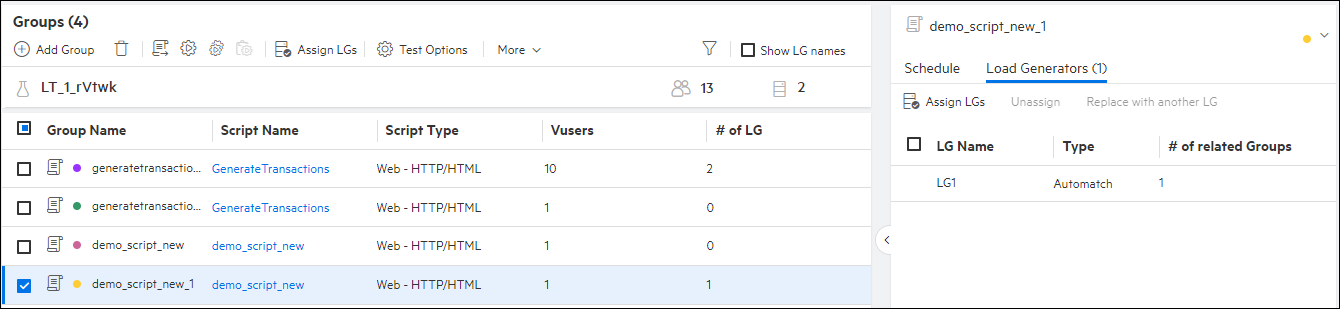
The Groups pane on the left is the area where you create groups by selecting scripts that emulate groups of users running on the application, distribute Vusers to the groups, and configure settings for your test. All actions in the Groups pane can be performed using the context menu.
The Group Details pane on the right contains the Schedule and Load Generators, and Virtual Location tabs where you define a schedule for the performance test and assign load generators to the groups, and add virtual locations (provided Network Virtualization is installed and enabled).
For details, see Define test workloads.
 See also: