Strategic planning
When you start to plan a portfolio, PPM provides the what-if analysis tool to help you foresee what happens if you invest on different scenarios. The tool analyzes the scenarios from three dimensions: budget, resources, and strategy.
This section provides details on the strategy dimension: how strategic alignment and business value analysis help you plan a portfolio.
For details about budget and resources planning, see Capacity planning in what-if analysis.
Strategic alignment
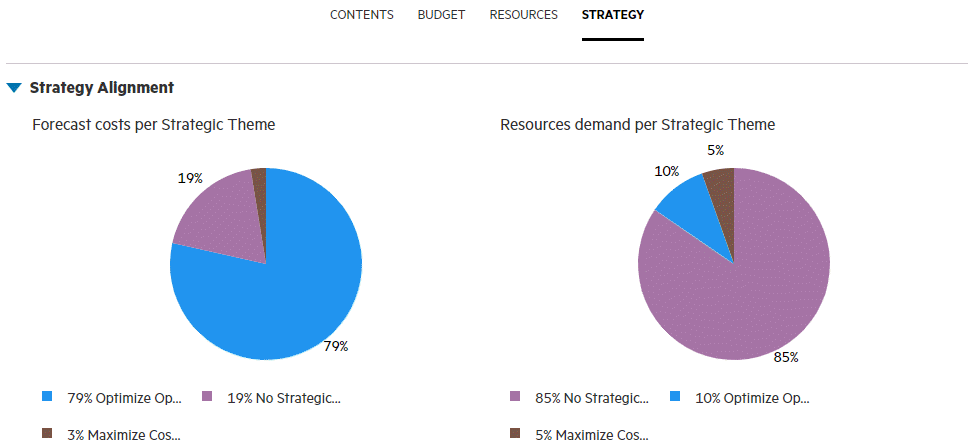
Are budget and resources aligned with strategic themes? The Forecast costs and Resources demand pie chats in the Strategy in Portfolio section of a strategic theme details page help you get the answer to this question.
The charts include the forecast cost and resource demand of the following initiatives:
-
The projects, proposals and assets that directly belong to the current portfolio and whose forecast cost and resource demand is not zero.
The costs and demands are grouped by the strategic themes with which these initiatives are aligned.
-
The projects, proposals and assets that are included in the programs that directly belong to the current portfolio and whose forecast cost and resource demand is not zero.
The costs and demands of these initiatives are rolled up to the program and are grouped by the strategic theme with which the program is aligned.
When the initiatives selection within the scenario changes, the two charts are updated accordingly.

Ideally, the proportions of strategic themes in terms of costs and resource demands should be aligned with how you define strategic themes.
For example, if more than half of the total forecast costs are targeting at a low-priority strategic theme, you may need to remove some initiatives serving that strategic theme and add some initiatives serving the high-priority strategic theme.
KPIs forecasting
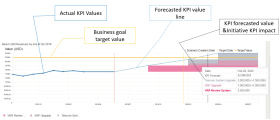
Will the portfolio hit the goals? Does it deliver maximum values? The KPI charts of each portfolio business goal in the business goal page > Strategy tab > KPIs Forecasting section help you make reasonable forecasting about business values.
The KPI forecasting chart illustrates the following:
- How each portfolio business goal performs in the past periods, based on actual KPI values.
-
How it is forecasted to develop, based on the initiatives' KPI impacts.
Note: The KPI forecasting chart is generated only when there are actual KPI values entered for the current date or a date earlier than the current date.
If you click on a legend color at the bottom of a chart, you remove the initiative KPI impact value from the chart. Clicking the legend color again adds the data back.
 See also:


