Portlets for managing IT demand
The IT Demand Management solution provides portlets to manage your IT demand. These IT demand portlets are included in the Demand Manager and Team Manager PPM Dashboard pages. Each of these portlets displays a table with data related to IT demand. Fields in each portlet's preferences allow you to filter which data is to be included in the displayed table and how it is to be organized (grouped). For example, you can group IT demand data by assigned user or by department.
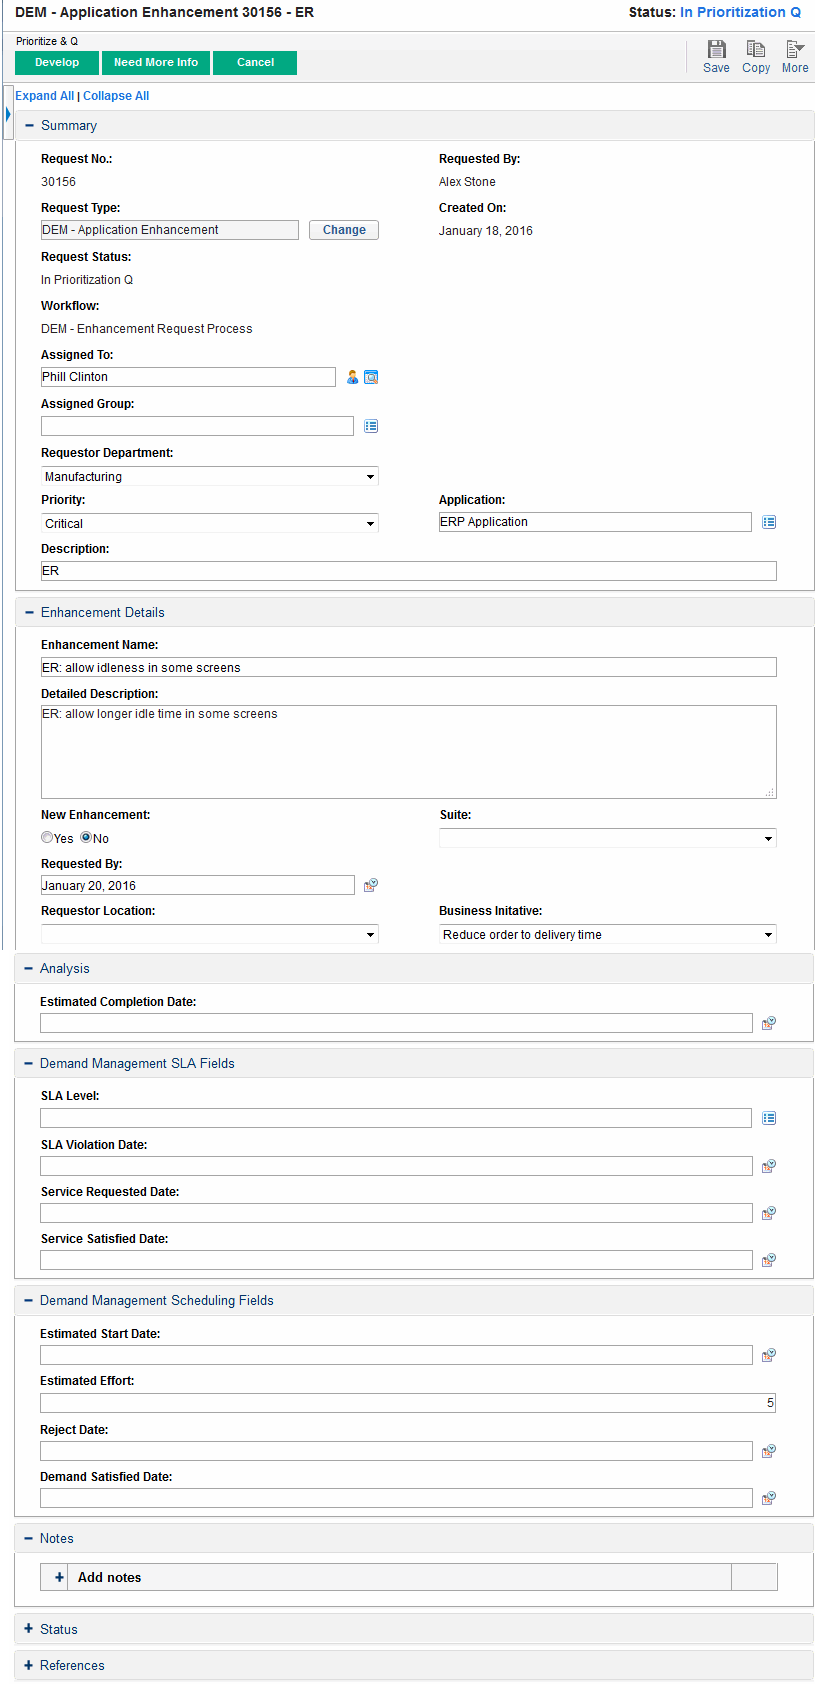
From the portlet results, you can drill down to the demand's request details by clicking the linked request number in the leftmost column of the portlet listings. For example, if you click request number 30303 in the In Process Demand portlet in Figure 2-5 in Team Manager PPM Dashboard Page, the request details appear as in Figure 2-6 in .
Note: Adding these IT demand portlets to your PPM Dashboard requires the correct access grants and security group permissions. If you do not have access to the IT demand portlets, see your application administrator.
Consolidated Demand Portlet
The Consolidated Demand portlet on the preconfigured Demand Manager page displays IT demand disposition data in a bar chart format. See Figure 2-4 in Demand Manager PPM Dashboard Page Resting the cursor over a bar in the bar chart opens a tooltip that lists more precise information about the IT demand data.
Click Manage This Demand to filter which data is to be included in the resulting graphs and to control how the information is organized. For example, you can group IT demand data by assigned user or by department.
Demand List and Request List Portlets
The following portlets are used to view lists of IT demand:
-
Demand List portlet. The Demand List portlet does not appear on either the preconfigured Demand Manager page or the preconfigured Team Manager page. It must be added individually to a PPM Dashboard page.
-
Request List portlet. The Request List portlet is personalized as:
- The Initiatives Pending Approval portlet on the preconfigured Demand Manager page (see Figure 2-4 in Demand Manager PPM Dashboard Page ).
- The In Process Demand portlet on the preconfigured Team Manager page (see Figure 2-5 in Team Manager PPM Dashboard Page).
Figure 2-6. Viewing a request from the In Process Demand portlet

Demand by Category Portlet
The Demand by Category portlet can appear on the dashboard in the following forms, depending on the requirements of your organization:
-
Demand by Department portlet and the Demand by Business Initiative portlet on the preconfigured Demand Manager page (see Figure 2-4 in Demand Manager PPM Dashboard Page ).
-
Team Demand by Priority portlet on the preconfigured Team Manager page (see Figure 2-5 in Team Manager PPM Dashboard Page).
The Demand by Category portlets display IT demand data in a bar chart format. Resting the cursor over a bar in the bar chart opens a tooltip that lists more precise information about the IT demand data.
Fields in each portlet's preferences allow you to filter which data is to be included in the displayed charts and how it is to be organized (grouped). For example, you can use the Group By field (in the Time Period section) to group IT demand data by assigned user, by department, by business initiative, or by other groupings.
Your preferences, including the grouping you select, are listed under the portlet title. If you also want to change the portlet title from Demand by Category to reflect your particular grouping, as is done in the Demand by Category portlets on the preconfigured PPM Dashboard pages shown in Figure 2-4 in Demand Manager PPM Dashboard Page and Figure 2-5 in Team Manager PPM Dashboard Page, click Change Title on the Edit Preferences page for the portlet.
Team Assignment Queue Portlet
The Team Assignment Queue portlet displays a table with IT demand data. From this portlet, you can view and assign a user to the IT demand. For more information about assigning users to an IT demand, see Assign IT demand.
SLA Exception Roll Up Portlet
The SLA Exception Roll Up portlet can appear on the dashboard in the following forms, depending on the requirements of your organization:
-
SLA Exceptions By Department portlet on the preconfigured Demand Manager page (see Figure 2-4 in Demand Manager PPM Dashboard Page ).
-
Team SLA Exceptions By Dept portlet on the preconfigured Team Manager page (see Figure 2-5 in Team Manager PPM Dashboard Page).
Each of these portlets displays SLA data in a bar chart format. Resting the cursor over a bar in the bar chart opens a tooltip that lists more precise information about the SLA data.
If you click View These Exceptions on either portlet, the SLA Exceptions page appears, as shown in the figure below.
Figure 2-8. Example SLA Exceptions page

From this page, you can click a particular request number to see its details.


