Share this page


Agile request management
This section explains how to manage requests in a Dimensions CM integration.
Requests
Requests are used to track and approve the changes your team is making.
A request is a single unit of work, equivalent to a story in Agile planning, that can report a defect, suggest an enhancement, or detail other work for a particular product. You use story points to estimate the size of a request.
For details about using Dimensions CM requests, see Work with requests.
Each Dimensions CM request type has a lifecycle assigned to it that determines which users may work on the request. For details about request lifecycles, see the Dimensions CM online help.
View requests
The request catalog displays all the requests in a Dimensions CM product. You can open a Dimensions CM request and view its information. For details, see View requests.
The Inbox in the My Work area displays a list of requests that are assigned to you in a product.
If a product is mapped to multiple request providers, the Catalog and the Inbox display requests by provider. You can view requests for one provider at a time.
When you open a request, Dimensions CM requests are displayed in PulseUno, while external requests open in their provider instance.

Backlogs
Backlogs enable you to organize your team’s work and group requests into a prioritized hierarchy of epics and features.
Note: Backlogs are supported for Dimensions CM requests only.
Backlogs are located at the product level in PulseUno. You can view a backlog as a hierarchy or as a flat view.
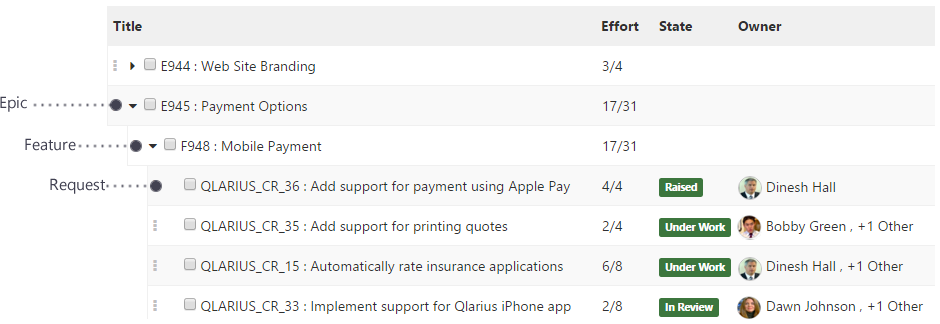
An epic is a large unit of work that is typically broken down into smaller units of features and requests.
Epics, features, and requests can belong only to one backlog, but you can move them between backlogs. Epics and features are optional, and you can plan a flat backlog that contains only requests.
The following figure displays the backlog structure with epics, features, and requests.
For details about backlog planning, see Plan and manage backlog.
Tip: You can deactivate the Agile feature and hide backlogs and iterations from the user interface. In your product, select Settings > Integrations on the sidebar, and clear the Enable Agile functionality option.
Iterations
An iteration is one development cycle, commonly known as a sprint, which typically lasts a few weeks.
Note: Iterations are supported for Dimensions CM requests only.
An iteration includes the requests your team is confident it can complete during the sprint. As an iteration progresses, the remaining effort required to complete the requests should decrease.
For details about managing iterations, see Plan and manage iterations.
Iterations are located at the product level in PulseUno. You can view an iteration as a list or a card wall.
Content tab
The Content tab displays the content of an iteration in a flat list and includes the following information:
- What requests are being worked on.
- For each request, its title, effort, current state, owners, and rank order in the iteration.
- The work progress and the effort, in story points, required to complete each request.
Tip: You can show or hide request labels and closed requests.
Card Wall tab
On the Card Wall tab, each card displays information about a specific request, such as:
- Which team member is working on it.
- The request’s story points.
- If the request is blocked.
- The number of days the request has been in its current state.
- A badge indicating its review state and the health of the changes.
Cards are grouped in rows by request type, with a separate column for each lifecycle state. Each request type displays the number of requests that are blocked, hidden, and unassigned.
A card wall also displays metrics about the progress of the current iteration:
| Metric | Description |
|---|---|
| In progress | Story points remaining to be completed (as a number and percentage). |
| Iteration end | The number of days left until the iteration ends. |
| Done | Requests completed (as a number and percentage). |
| Burndown chart | Displays how much work remains in the iteration. Helps predict when the work can be completed. |
| Burnup chart | Displays how much work has been completed and the total amount of work. |
For details about customizing the card wall view, see Use the card wall.
The History tab displays changes made during an iteration, for example, requests that were added.