Share this page


Strategic planning
What-if Analysis provides widgets for strategic planning. This section provides some examples of how to plan your portfolio from a strategic perspective.
Analyze strategic alignment
Use the Cost Distribution by Strategic Theme chart included in the Strategic Prioritization Planning View layout template to evaluate if your budget aligns with the strategic themes.
The Cost Distribution by Strategic Theme pie chart shows the forecast costs of all items included in a scenario, grouped by strategic themes. When the content selection changes, the chart updates accordingly.
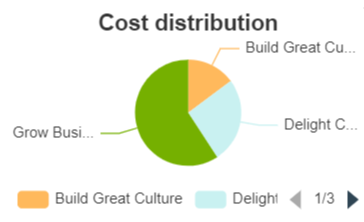
The chart helps evaluate if your budget aligns with strategic priorities. Ideally, the cost distribution should match strategic priorities. If a significant portion of the budget is allocated to a low-priority strategic theme, you may need to adjust your content to better align with high-priority strategic themes.

Analyze strategic capacity
When planning portfolio content, use the Strategic Capacity Indicator to track the capacity for strategic themes and ensure they stay within the defined budget limits.
Tip: To analyze strategic capacity using the Strategic Capacity Indicator, include it in a layout template and configure how demand and capacity is calculated. For details, see Configure strategic capacity indicator.
Analyze portfolio business goal performance
The KPI Indicator helps you assess whether a portfolio can achieve its business objectives.
Tip: To view the KPI Indicator, use the predefined Strategic Planning Gantt View layout template or add the widget to a custom layout template. For details, see Configure KPI indicator.
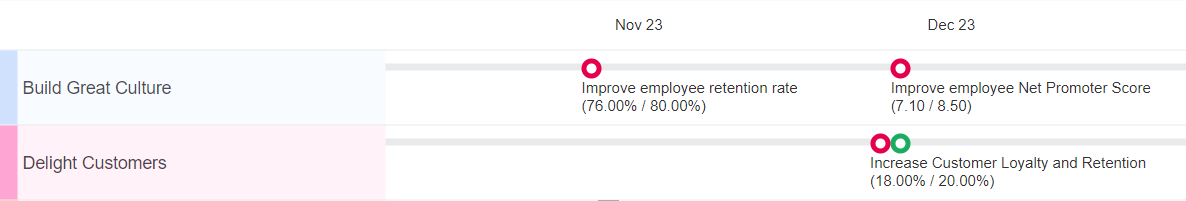
The left side of the KPI Indicator lists the strategic themes associated with the portfolio. Business goals related to each strategic theme are displayed as circles in the corresponding time period column.
Note: Only business goals with a target value and target date are included in the chart.
What-if Analysis compares each business goal's expected value to its target value.
- If the expected value meets or exceeds the target value, the goal is marked green.
- If the expected value falls below the target, the goal is marked red.
Expected value calculation
The expected value of a business goal is calculated as follows:
Expected value = Actual KPI value + Forecasted KPI value
- Actual KPI value: The KPI value recorded on the current date or the most recent preceding date.
-
Forecast KPI value: The sum of KPI impact values from all portfolio contents, including only those with effective dates after the current date and on or before the business goal's target date.
When the content selection in a scenario changes, the business goal's expected values are updated accordingly.
 See also: