Share this page


Dashboard actions and alerts
This topic describes the actions you can perform via the Dashboard during runtime, and the LG alerts displayed in the dashboard.
Pause scheduling during a test run
You can configure a load test to enable you to pause the schedule while the test is running. This gives you more control over the test's workload.
You can pause the scheduling multiple times during a test run, but the total pause time cannot exceed the maximum time that you set in the Test settings. To enable schedule pausing, before running the test, select the load test's Test settings > Pause scheduling up to check box. For details, see Pause scheduling.
- To pause scheduling when viewing an active test run in the dashboard, click the Pause scheduling button on the toolbar. A counter displays the available time that the schedule can been paused during the run.
- To resume, click Resume scheduling.
In the test run's report, the Pause Scheduling table displays the pause and resume instances that occurred during the run. For details, see Report.

Change the Vuser load dynamically
You can dynamically increase or decrease the number of running Vusers during the test run by adjusting the value in the Change Load box. To add Vusers to the number of running Vusers, make sure you have the Add Vusers option selected in the test's Test settings. No additional setting changes are required to decrease the number of running Vusers. For details, see Add Vusers.
To change the number of running Vusers during a test run:
-
Click the
 Change Load button.
 -
In the Change Load dialog box, enter the number of users that you want to assign to the displayed scripts. You cannot exceed the maximum number of users displayed. The Max value is the number of Vusers configured for the script, or the same number plus the percentage defined in advance for Add Vusers (if this option is enabled for the test).
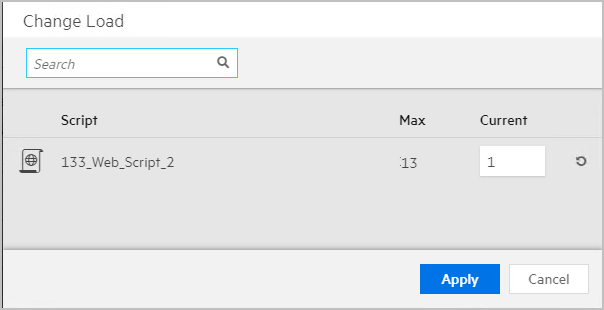
-
Click Apply.
Notes and limitations
-
Change Load is only enabled when all Vusers in all scripts are in Duration mode. If Vusers in at least one script are ramping up or ramping down, or a script finishes running, the change load capability is no longer available for the remaining scripts.
-
You cannot change the load for scripts that contain rendezvous points.
-
When you remove Vusers, you are actually suspending them. If you later decide to add more Vusers, the suspended Vusers are added first.
-
If the script was created using VuGen, enable the Simulate a new user on each iteration option (Runtime Settings > Browser Emulation) to allow you to resume suspended Vusers during a test run.
-
Suspended Vusers run a
vuser_end()action at the conclusion of the test. This may cause unexpected behavior in the test results.
Runtime alerts
The Alerts section in the right-hand side of the summary bar, alerts you to problems that were found during the test run. These alerts are visible both during and after test runs. For each problem category, the number of issues is displayed. The number of unread notifications, if there are any, is further displayed in a red badge.

To view the problems, click a category name. A horizontal ellipsis indicates that a dropdown is available. A new window opens with a list of all the problems in the category. By default, the list is sorted by the problem start time. You can sort the list by any of the metrics included in the list by clicking a column header.
The following problem categories are displayed in the Alert bar:
| Category | Description | Additional actions |
|---|---|---|
| SLA Warnings | Lists transactions that broke the defined SLA threshold. |
Note: When you add a problem's metric to the dashboard (either in an existing graph or in a new graph), the dashboard's time frame is automatically adjusted to that of the problem's time frame. This affects all the graphs included in the dashboard. |
| Anomalies |
Lists measurements that significantly changed their behavior. Click > to open an anomaly and view all the relevant metrics it contains. |
|
| Errors |
Shows the number of errors encountered while running the scripts in the test. Known limitations:
|
|
| LG Alerts |
Lists scripts, for each load generator, that had any of the following problems:
|
Click the |
| Streaming Alerts |
Lists the number of errors encountered during a load test that could not be sent to Splunk. Note:
|
 Show snapshots to view a snapshot of the error.Click the
  Download all snapshots button to download all the error snapshots to a zip file. Each error snapshot is included as a separate file within the zip file.
 See also: