Share this page


Report
LoadRunner Cloud's new report provides statistics and performance data for a test run.


Report overview
LoadRunner Cloud's Report page displays information about your load test run. Open the report in one of the following ways:
-
Go to the Load tests page, click a test, and navigate to the Runs
 pane. Select a run and click Report.
 -
Open the Results page and click
 (more options) in the row of the selected test run. Click Report.
By default, the Summary and Transactions report sections are displayed. For details ,see Report sections.

Set the report time frame
The time frame for which report results are displayed is shown above the report.

You can change the time range using one of these options:
-
Drag, stretch, or shrink the time slider.
-
Change the start and end time counters.
Report sections
You can choose which sections to display in the report by selecting the check box for the section in the left pane. In most tables, you can sort the lists by any column.
The following table shows the various sections available in the report.
| Section | Description |
|---|---|
| Summary |
The report summary provides an overview of the test run including duration, status, and important performance statistics such as average throughput. The following data is displayed in the Summary section:
|
| Top 10 Transactions |
The following data is displayed for the 10 transactions with the highest number of passes:
|
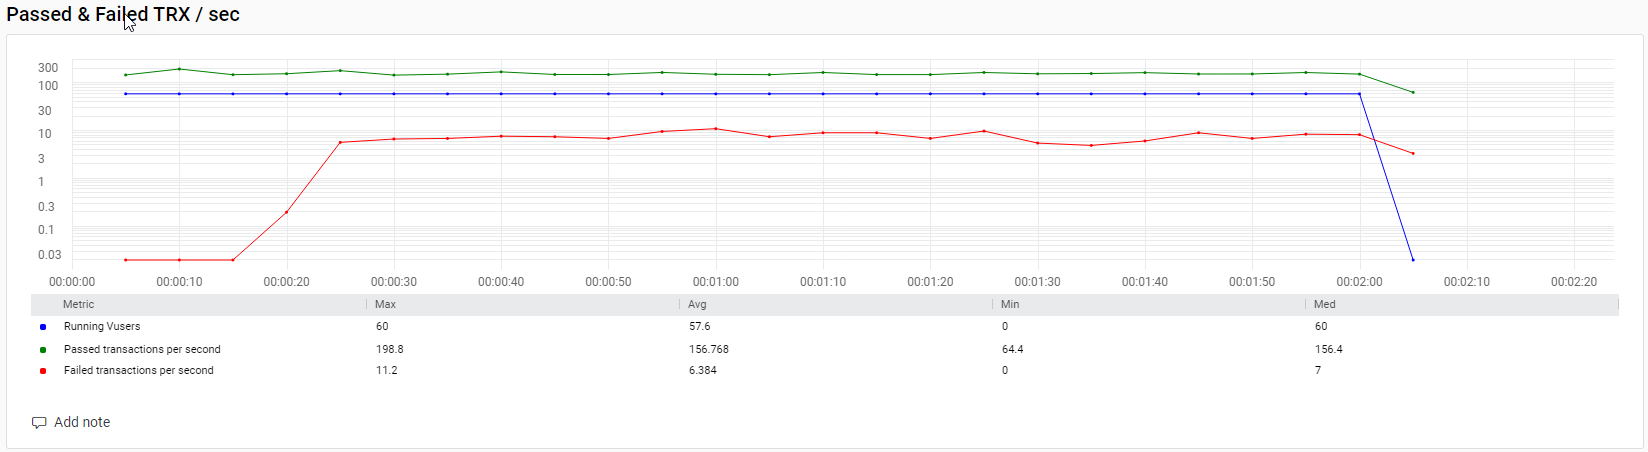
| Passed and Failed Transactions |
This graph shows the following data throughout the test duration:
The average and maximum values for these metrics are displayed in a table under the graph. |
|
Transactions |
The following data is displayed for the transactions in your test's scripts:
|
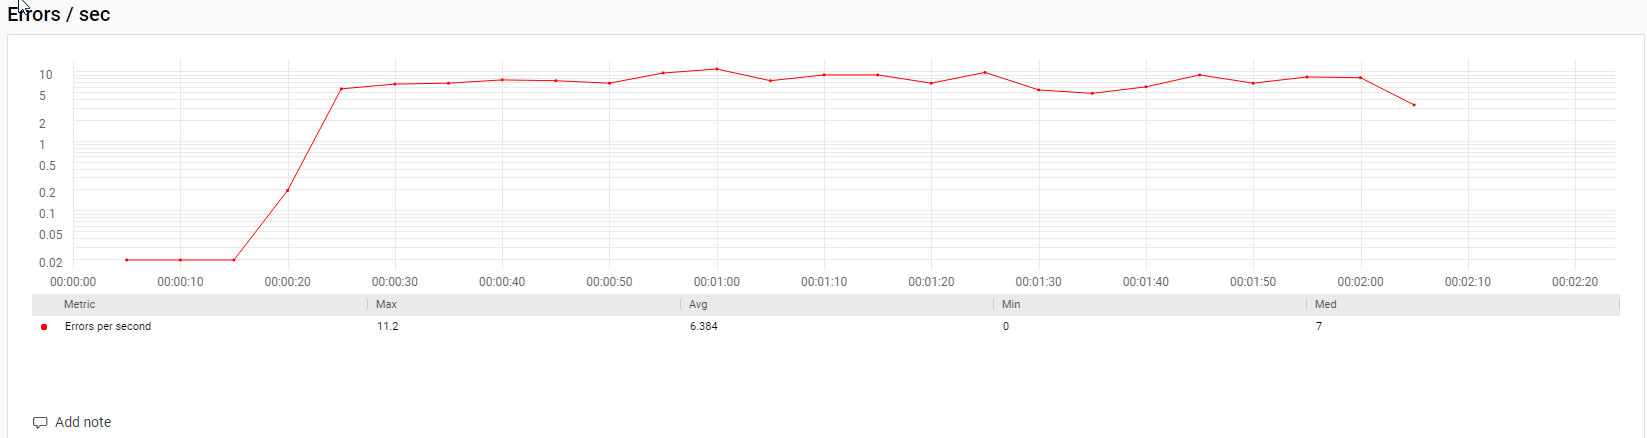
| Errors per Second |
This graph shows the errors per second. The average and maximum values for these metrics are displayed in a table under the graph. |
| Errors Summary |
A list of errors encountered by Vusers during the load test run. The following data is displayed for errors:
|
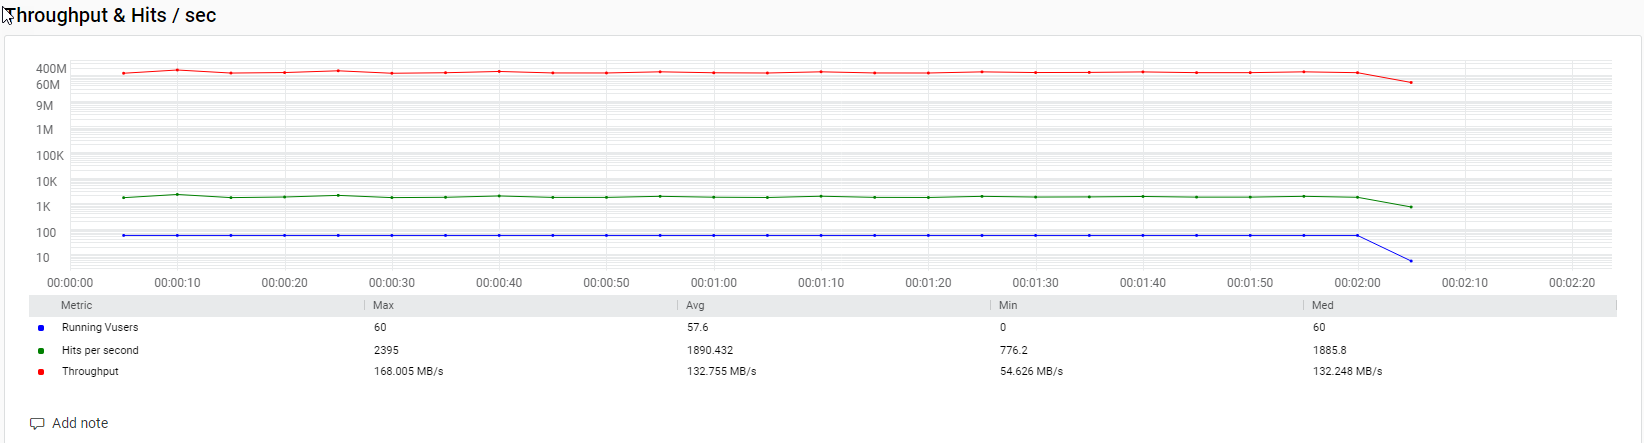
| Throughput and Hits per second |
This graph shows the following data throughout the test duration:
The average and maximum values for these metrics are displayed in a table under the graph. |
| Scripts |
This table lists all the scripts that were included in the test definition, and their configuration. |
| Distribution | This table shows how the test Vusers were distributed over load generators during the test run. |
| Monitors |
This table shows resource usage for server and application Monitors that were configured to work with LoadRunner Cloud. For each metric, the table shows its average and maximum value. |
| LG health monitoring |
This table shows system health and resource usage for both on-premises and cloud-based load generators. The system health metrics include CPU, Disk (on-premises only), and Memory. |
| HTTP Responses |
The table lists the HTTP responses received during the test run and shows the total number received for each response code. Note: The average number of HTTP responses is an estimate based on the selected time frame. |
| OPLG Scripts |
The table lists which scripts ran on which on-premises load generators. The OPLG Scripts table shows:
|
| OPLG Errors |
The table lists the top three errors for each script that occurred on on-premises load generators during the test run. Note: This section is only available for scripts run on on-premises load generators version 3.3 or later. The following data is displayed for errors:
|
| Pause Scheduling |
The table lists the pause and resume schedule actions that occurred during the test run. For information about pausing a test, see Pause scheduling. The following data is displayed for pause scheduling:
This table is only available if Pause Scheduling was enabled in the Run configurations settings. |
Percentiles
A percentile is a statistical tool that marks the value into which a given percentage of participants in a group falls. In the context of test runs, if you check against the 90th percentile, you are looking to see which tests performed better than 90% of tests that participated in the run.
The following algorithms are commonly used to calculate percentiles:
| Algorithm | Description |
|---|---|
| Average percentile over time | This method calculates the average percentile over time—not the percentile for the duration of the test. The percentile is calculated per interval (by default 5 seconds). The dashboard and report show an aggregate of the percentile goals. |
| Optimal percentile (T-Digest) | An optimal (not average) percentile, based on the T-Digest algorithm introduced by Ted Dunning as described in the T-Digest abstract. This algorithm is capable of calculating percentile goals for large raw data sets, making it ideal for calculating percentiles for the large data sets generated by LoadRunner Cloud. |
LoadRunner Cloud algorithm usage
For the Report:
-
Tenants created before May 2020 (version 2020.05):
- Tests created before version 2020.10 (prior to October 2020), by default use the Average percentile algorithm to calculate the percentile.
- Tests created with version 2020.10 or later (from October 2020), by default use the Optimal percentile (T-Digest) algorithm.
- You can toggle the Optimal percentile (T-Digest) option on and off as described in Optimal percentile (T-Digest).
-
Tenants created in May 2020 and later (from version 2020.05) by default use the Optimal percentile (T-Digest) algorithm to calculate percentiles in all tests.
Note: For the Dashboard, LoadRunner Cloud uses the Average percentile over time algorithm.
Percentile calculation
Typically, percentiles are calculated on raw data, based on a simple process which stores all values in a sorted array. To find a percentile, you access the corresponding array component. For example, to retrieve the 50th percentile in a sorted array, you find the value of my_array[count(my_array) * 0.5]. This approach is not scalable because the sorted array grows linearly with the number of values in the data set. Therefore, percentiles for large data sets are commonly calculated using algorithms that find approximate percentiles based on the aggregation of the raw data.
LoadRunner Cloud uses the Optimal Percentile method, based on an algorithm known as T-Digest. This method was introduced by Ted Dunning in the Computing Accurate Quantiles using T-Digest abstract.
Recalculate the percentile
After a test run, you can recalculate the percentile for the transaction response time.
In the Transactions or Top 10 Transactions sections, expand the Percentile dropdown, select a new percentile from 1 through 99, and click Apply. The values in the grid change accordingly. For details, see Report sections.
Differences between percentile calculations between LoadRunner family products
If you have similar tests running in LoadRunner Cloud and LRP or LRE, you may notice a difference in the response times, as shown by the percentile. This differences can be a result of the following:
- LRP and LRE calculate the percentiles based on raw data. To do a fair comparison, make sure that you run your test in LoadRunner Cloud with the Optimal T-Digest algorithm.
- Think time setting should be consistent in your test runs. If tests in LRP or LRE include think time, while the same test excludes think time in LoadRunner Cloud, you may see differences in the calculated percentile.
-
Even if your test on LRC runs with the Optimal percentile, for small sets of TRT (transaction response time) values you may encounter discrepancies. Typically this happens when T-Digest outputs results outside of the actual dataset, by performing average between values in the dataset, whereas other algorithms may also output values from inside the dataset.
The following table shows the percentile calculation based on T-Digest using a small set of values:
TRT values Percentile Value 1,2,3,4,5,6,7,8,9,10 90th 9.5 1,2,3,4,5,6,7,8,9,10 95th 10 1,2,3,4,5,6,7,8,9,100 90th 54.5 1,1,2,3 50th 1.5
Add a dashboard graph custom snapshot
Save a snapshot of a customized graph in the dashboard and display it in the report for the run.
Add a snapshot from the Dashboard
- Navigate to the new dashboard for a specific run.
- Customize a graph with the data you want to view.
- Click the Add to report
 icon in the toolbar of the graph to save the snapshot. The snapshot is added as a section in the report.
For details on working in the dashboard, see Dashboard.
Note: You can add a maximum of 10 snapshots to a report.
Configure a snapshot in the report
Use the following actions to configure a snapshot in the report:
| Action | How to |
|---|---|
| Rename a custom snapshot |
|
| Exclude a snapshot from the report | Deselect the custom snapshot in the sections list on the left. |
| Remove a custom snapshot | Click the X at the top of a custom snapshot in the report viewer. |
Add notes
When viewing a report, you can add notes to the individual report sections.
To add a note to a specific report section, click ADD NOTE at the bottom of the section. In the dialog box that opens, enter your note and save it.
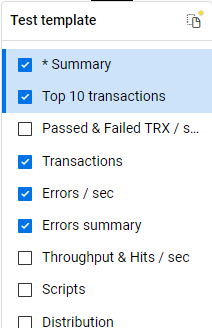
Create report templates
The Reports window lets you save and load report templates. This capability lets you configure a report layout and save it as a template for future use. Using templates prevents you from having to reconfigure the same layout for each run report.
The report templates are stored as assets of LoadRunner Cloud. To view the templates that are available for your tenant, navigate to Assets > Templates. For details, see Templates and Report template demos.
The template name is shown above the list of the report sections. If there are differences between your current configuration and the template, they are indicated by an asterisk and a yellow notation above the ellipsis.
To save a layout as a template:
- Configure your report to show the sections that interest you.
- Click the report templates icon
 on the top of the sections list.
 - In the Template management menu, select Save as.
To load a template for your report:
- Click the report templates icon on the top of the sections list.
-
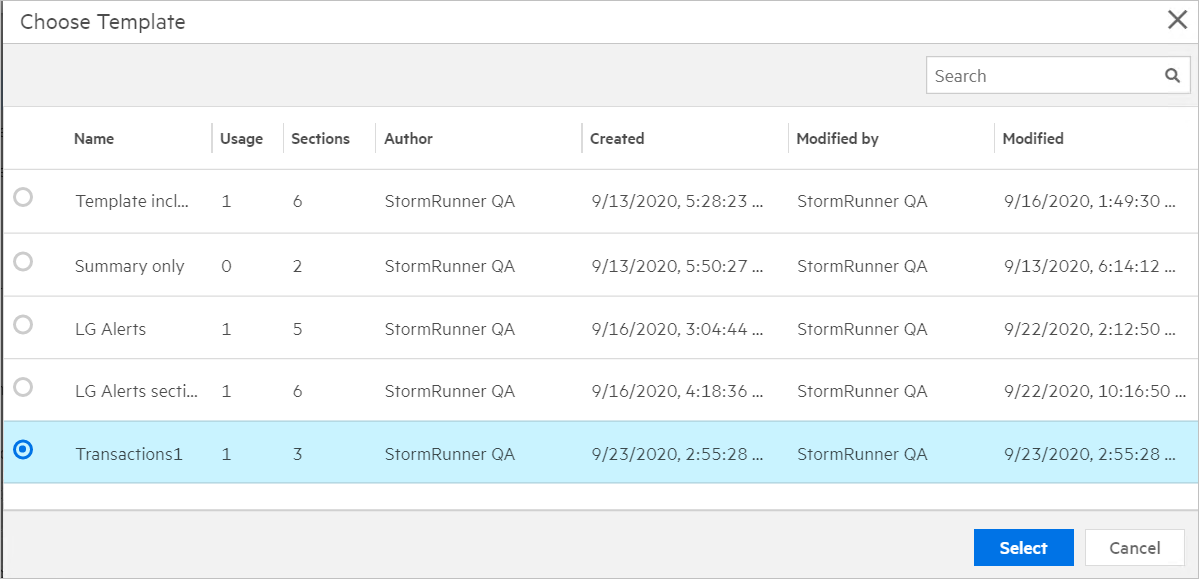
In the Template management menu, select Select template.
-
Choose a template, and click Select.

Template actions
Perform an action using the Template Management menu ![]() .
.
-
To discard the differences between your layout and only use the layout of the chosen template, select Discard changes.
-
To overwrite the selected template by applying the current layout to the selected template, select Save changes.
-
To save the current layout as a new template, select Save as.
Update template with transaction changes
You can modify an existing report template to reflect transaction changes in your test scenario. This includes:
-
Removing empty metrics from the template. For example, transaction data from the original test that is used to build the template.
-
Adding additional transactions to a template. For example, if you created a snapshot for a dashboard graph for the current run, and you want to include this in the template.
-
Navigate to the dashboard for the specific run.
-
To delete the empty metrics from the original script, click Delete empty metrics above the metrics pane.
-
Customize the graph with the data you want to view, and click the Add to report
icon in the graph's toolbar. -
Add sections for the new scenario to the template.
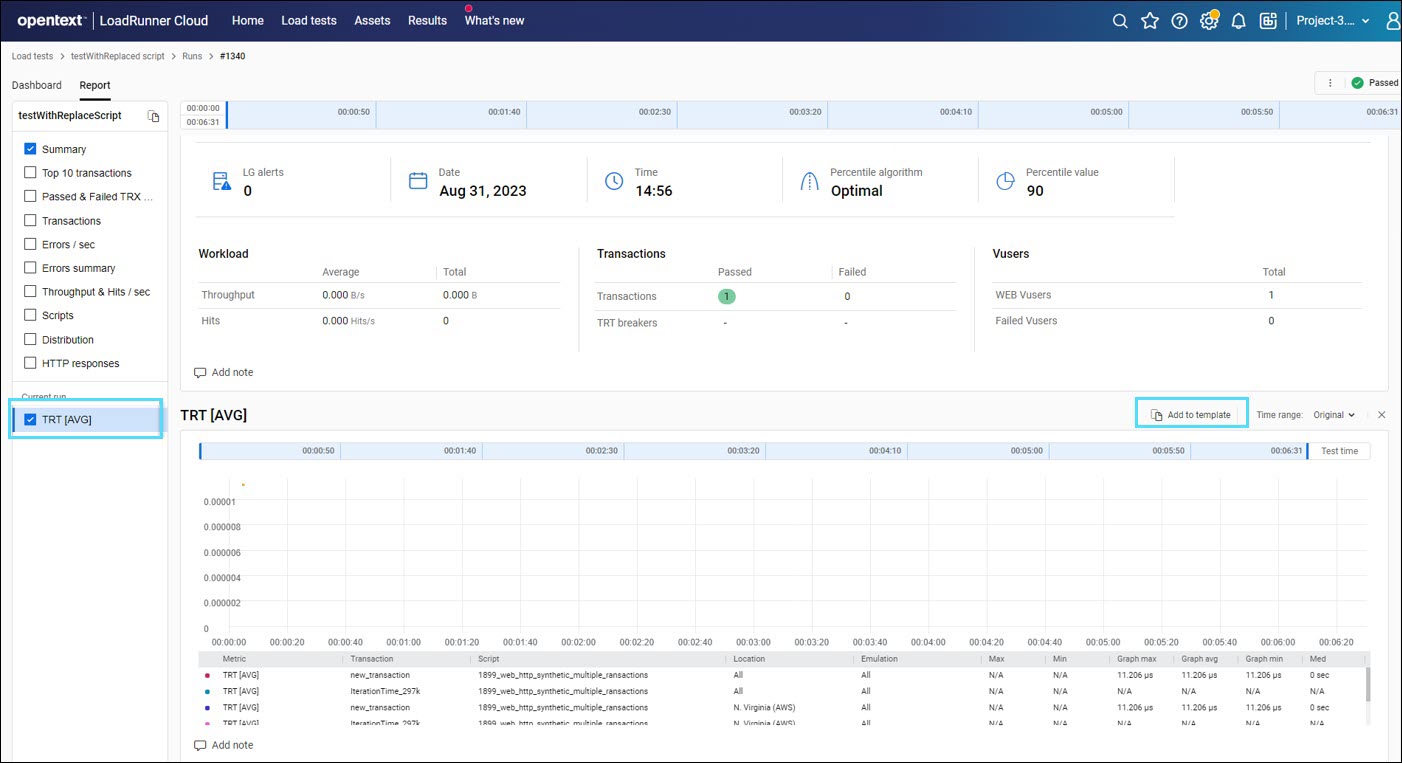
-
Open the Report tab, select the sections that you want to apply to the template, and click Add to template.
-
In the Template Management menu (at the top of the sections list), click the report templates icon
, and select Select template. -
Choose a template, and click Select to load a template for your report.
-
In the Template Management menu, click
and select Save changes to apply the current layout to the selected template.
-
Export report results
For details on exporting report results in different formats and for sending report results by email, see Run results actions.
 See also: