View and analyze pipelines
After a pipeline run, the Pipeline summary displays information about the pipeline run status, its run history, related code changes, affected application modules, and more. You can also find analytic information about failed tests and tools to help you analyze pipeline run results.
View a pipeline's summary
Open the global menu  and select the Quality > Pipelines > Analysis module to see summary data representing all of your pipelines.
You can perform the following actions from the summary bar.
| Action | Description |
|---|---|
| Filter the summary bar |
Click the Filter pipelines button |
| View last pipeline run |
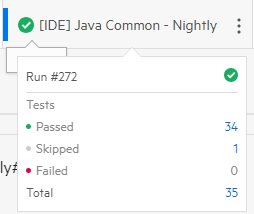
For each pipeline that ran after it was added, you can see details about the last pipeline run. An icon shows the status of the last run.
You can see the status of automated tests that ran as part of the build. The pipeline run results are aggregated (combined) at the highest level, the pipeline root. Click the number of tests in each status to open the pipeline's test details in the main view. You can switch between compact and expanded view. Click the Show more/less info in pipelines button To scroll between pipelines in the summary bar, click the directional arrows on the ends of the bar. |
| View pipeline progress |
A progress bar The estimated percentage of completion in the progress bar is based on the duration of previous runs, if available. Otherwise, a striped bar Pipeline run results are updated automatically in the card when the run is finished. |
| View multibranch pipelines |
If you are working with multibranch pipelines, the parent container appears with no data. Each branch is displayed as a regular pipeline, using the naming format <parent name>/<branch name>. For details, see Special pipeline types. This is an example of a container with a multibranch icon, followed by its two branches: |
| Access a pipeline's menu command |
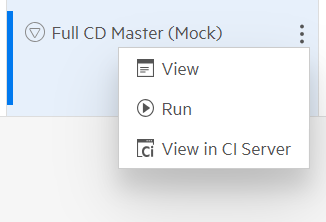
Select a pipeline in the summary bar and click the Menu button If you are working with Multibranch pipelines, you can use the pipeline's menu commands to filter which branches to show. Note that the filtering is not retroactive, so that once a branch is created, modifying this filter does not remove the branch from the Pipelines display. |
| View pipeline history timeline |
The pipeline history timeline shows the status (by color) and duration (by size) of each run. Hover over a column in the timeline to see detailed information about that run. Click a column to open a run and investigate it. |
View the run structure and its job statuses
In the Pipeline Analysis window, choose one of the following:
-
Select a pipeline in the summary bar.
The job hierarchy of the pipeline's latest run, and the most recent status of each job, are displayed.
-
Select a run from the Run selector to go to that run. After you select a run, clicking refresh will not change the selection.
-
When you select Latest in the Run selector, the most recent run's details are displayed. If a pipeline is running, you see its current progress.
If you select Latest and a newer run becomes available, you need to refresh the display to see the newer run. If you are investigating a failure, this helps you stay in the failure context.
Analyze a pipeline run
When you open a pipeline to its root node, the pipeline's Overview tab opens. This tab contains widgets that show summary information about the selected pipeline's latest or most recent pipeline runs. For details, see Pipeline status and trend - Overview tab.
To analyze the results of a specific pipeline run, use the Builds, Test Runs, and Logs tabs to learn more about builds and automated tests that were part of this run. You can see how many of your tests ran successfully, how many were skipped or unstable, and how many failed, and then learn why tests are failing.
Click a job to see its associated tests, builds, and log details.
| Select | To |
|---|---|
| Builds | Further investigate build failures. For details, see Analyze build failures. |
| Test Runs | Further investigate problems and analyze run results. For details, see Analyze test failures. |
| Logs | Analyze the build log. For details, see Analyze build log messages. |
Drill down into a pipeline
In the Pipeline Analysis window, select a pipeline in the summary bar and click the Menu button  . From the pipeline's menu options, select View.
-
The Details tab displays information about the pipeline's definitions, as well as the Pipeline run success rate and Average success duration. These are based on all pipeline runs, since the pipeline was created.
-
The Follow button enables you to receive notifications in email and in My Work, according to your preferences. You can receive notifications if your commit was involved in a failed run, if your test fails, or if the pipeline run fails.
-
In the Runs tab, you can see a list of all the pipeline runs, dating back to when you added the pipeline.
For each run, you can see its status, duration, and more.
Open a specific pipeline run to view more details and to analyze test failures.
To drill down to a pipeline run:
-
Open the global menu
 and select Quality > Pipelines > Manage.
 -
Select a pipeline.
-
Open a specific pipeline run:
-
To open a latest run, in the pipelines grid, click the ID of a Last completed pipeline run.
-
To open a previous run:
-
Click a pipeline's ID to open it in details view.
-
Select the Runs tab.
-
In a grid view, filter and sort the grid to locate a specific run.
-
Click the run's ID.
-
-
-
In the Details tab, you can see an overview of the pipeline run information, including time, status, number of changed files included in commits on this run, and pipeline run history
 .
. -
Add tags to label the run. The tags are displayed in the pipeline's list of runs, and can be used to group pipeline runs in dashboard widgets.
-
Click the build number to open the specific run on the CI server.
-
Manage pipelines in a central location
In the Pipelines module, click the Manage tab to view a grid of all your pipelines. This is particularly useful if you need to manage large numbers of pipelines.
Each row displays a pipeline's details, and you can filter and group pipelines for centralized management. For example, if you filter by last run status, you can quickly focus on areas that need attention.
Use menu commands for the following:
-
Run a pipeline directly.
-
Select a pipeline and click the View in CI Server button
 to access the pipeline in your CI server.
 -
Select one or more pipelines and click the More button
 to share information about pipelines, and to receive notifications according to your preferences.
View and share a live summary of your pipelines
To see a summary of your pipeline runs, in the Pipelines module banner, click the Live Summary View button  . If you have multiple pipelines running, you can click Choose Pipelines to view a subset of them, or to search for a specific one.
The summary provides information about the pipeline's history, its status, and progress. You can see:
-
The status of the last few runs.
-
What triggered the last run (system or commit).
-
If triggered by a commit, you can see who committed and what files changed.
-
The progress of the current run.
-
After the tests are completed, an aggregated summary of the test run results.
This view is suitable, for example, for displaying on a group plasma screen. This enables the whole group to view the overall build status and quality.
Note: This information is obtained from the CI server and may include information from runs that occurred before the pipeline was added.
Working with programs in pipelines
In SAFe methodology, a program represents an "important, ongoing system development mission". For details on working with programs, see Programs.
If you have defined programs, you can assign a pipeline to a program either when creating the pipeline, or through the Program field in the pipeline's Details pane.
When you have pipelines assigned to programs:
-
You can filter the information displayed in the Pipelines module using the programs selector in the toolbar, next to the workspace selector.
-
After a pipeline runs, its assigned program is propagated to the pipeline run, test run, and run history.
-
By default, after a pipeline runs for the first time, its assigned program is assigned to the automated test. You can change this setting using the shared space parameter AT_PROGRAM_POLICY, which has the following possible values.
Value Definition none Programs on pipelines are not propagated to automated tests.
new_only (default) The program is propagated to the automated test the first time a pipeline runs, but the program on the test does not change in future runs.
every_run The program is propagated from the pipeline to the automated test every time the pipeline runs.
 See also:


 and use the filter options to filter by release, or display specific pipelines that interest you. For details, see
 to show more or less information about pipelines in the list. When looking at pipelines in the compact view, you can hover over the status icon to display the number of tests in each status.
 above the pipeline box indicates that a new run of the pipeline is currently in progress. The color of the progress bar indicates the status of the previous run.
 is displayed.


