This topic explains how to use the NV Insights, a comprehensive network analysis report that provides information about how your application performs over various types of networks (virtual locations).
NV Insights Report Overview
The NV Insights report is a standalone HTML report that covers all of the workload groups in a single report.
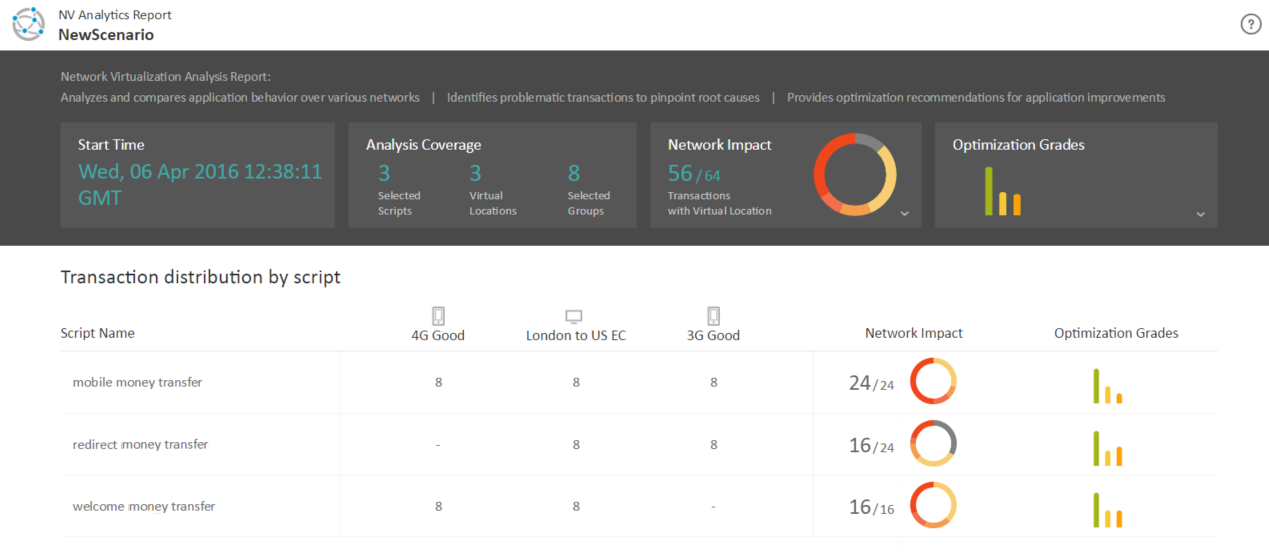
The main page of the report provides a dashboard showing summary information for the workload and each of its group's scripts. The impact of different networks on transaction duration is clearly illustrated, as are optimization grades that include links to optimization recommendations for your applications.
Drill down in the report to view (partial list):
- graphs and tables that illustrate the effect of network impact on each transaction
- optimization recommendations for improving your application's performance
- various summaries
- HTTP analysis for host resources and session participants
- resource breakdown by instance and size
- endpoint latencies
- client-side breakdown data, providing links between the client activities and network traffic
For more details on how NV generates the data shown in the report, as well as in-depth descriptions of what the report includes, see NV Insights in the LoadRunner & Performance Center Network Virtualization Help.

Considerations for Working with NV Insights
-
NV Insights is available for the following protocols: Flex, SAP Web, Siebel Web, TruClient-Firefox, TruClient-Internet Explorer, and Web HTTP/HTML.
-
When scheduling timeslots for running performance tests, make sure to allow additional time (of approximately 15 minutes) for an NV Insights enabled performance test.
-
Your Controller and load generators may require additional disk space for processing the NV Insights results.
-
An NV Insights report is not generated if the test run is deliberately stopped while Vusers are still running.
-
When using NV Insights, the Controller creates hidden Vusers (2 Vusers for each group) in addition to the Vusers defined in the scenario scheduler. If the scenario includes parameters with unique data, make sure that the list of parameter values includes several extra values for the additional Vusers.
-
By default, the Controller automatically allocates a unique block of parameter values for each Vuser in the scenario, and assigns the values to the parameter for each Vuser. When using NV Insights, you need to manually allocate data blocks for the Vusers. Open the Parameter List dialog box from VuGen, under Allocate Vuser values in the Controller, select Allocate x values for each Vuser. Alternatively, use VTS (LoadRunner Virtual Table Server) to set your unique parameters.
-
If your test includes several groups, you may need to increase the time needed to generate the report. Edit
<Performance Center Host installation root folder>\config\wlrun7.ini. Under the [General] section, update the value for theNVAnalyticsTimeoutparameter. By default, 10 minutes (in seconds).
How to Integrate NV Insights into a Performance Test
The task describes how to generate the NV Insights report for your test.
-
-
Make sure that you have NV installed on the following machines:
-
the Performance Center server
-
the load generators
-
the Controller
For more details, see LoadRunner & Performance Center Network Virtualization Help.
-
-
Make sure that you have a properly designed performance test. For details, see Define a performance test workload.
-
-
-
In the Performance Test Designer window, click Groups & Workload. For user interface details, see Performance Test Designer > Groups and Workload.
- Click
 . The Virtual Location Editor dialog box opens. For user interface details, see Virtual Location Editor dialog box.
 - In the Virtual Location Editor dialog box, set the Virtual Location Mode to On.
- Set the Virtual Location Mode to Per Group.
- Click Common Settings. Opens the Virtual Location Test Level Settings page. Set Enable Packet Capture to Yes. For details, see LoadRunner & Performance Center Network Virtualization Help.
-
-
Include NV Insights in the performance test
-
In the Performance Test Designer window > Groups & Workload view, under the NV Insights column, select the NV Insights check box for each group that you would like to include in the NV Insights report.
Note: The NV Insights check box is available for the following script types: Flex, SAP Web, Siebel Web, TruClient-Firefox, TruClient-Internet Explorer, and Web HTTP/HTML.
-
Define virtual locations (recommended). Under the Virtual Location column, click the Select virtual location link. The Virtual Location dialog box opens. Select a virtual location.
- Define the rest of the test workload. For details, see Define a performance test workload.
-
-
Click Run or Save and Run.
- Note:
- For each group enabled with NV Insights, the script will run 2 additional iterations each with a single Vuser (free of charge). Note that the additional measurements will be included in the analysis reports and usage reports.
- Clicking the Stop Now button also stops the process from generating the NV Insights report.
For more details on running a performance test, see Manage a performance test run.
-
-
From the Performance Center navigation toolbar, click
 and select Test Runs (under Testing).
- Select a test run, and click
 View Results. Click NV Insights Report. The NV Insights report opens. For in-depth descriptions of what the NV Insights report includes, see NV Insights.
- To download the NV Insights report, under the Results tab, select the NVInsights.zip and click
 .
. Note: If you encounter an error that the file path is too long when extracting a report (because the transaction and/or script name is too long), you can manually download and open the NV Insights report.
For user interface details, see View and manage test run results.
-