Administration dashboard
The administration dashboard provides a top level summary view of host resource usage and information for test runs across all projects in the system.
To access:
To access the dashboard, select Dashboard on the LoadRunner Enterprise Administration sidebar. The Dashboard page is displayed by default when opening LoadRunner Enterprise Administration.
User interface:
User interface elements are described below:
|
UI Elements |
Description |
|---|---|
| Toolbar | |
| <LoadRunner Enterprise Administration toolbar> | For details on the buttons in the LoadRunner Enterprise Administration toolbar, see LoadRunner Enterprise Administration user interface. |
| Hosts | |
|
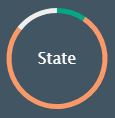
State
|
The host state distribution across all projects: Idle, Installing, Rebooting, Running, and so forth. Hover over a section of the pie chart to see the number of hosts in a particular state. Click a particular host state in the pie chart to open the Hosts page filtered by that state. For details, see Manage hosts. |
|
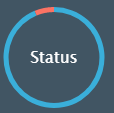
Status
|
The host status distribution across all projects: Operational, Non-operational, or Unavailable. Hover over a section of the pie chart to see the number of hosts with a particular status. Click a particular host status in the pie chart to open the Hosts page filtered by that status. For details, see Manage hosts. |
|
Purpose
|
The host purpose distribution across all projects: Controller, Load Generator, or Data Processor. Hover over a section of the pie chart to see the number of hosts with a particular purpose. Click a particular host purpose in the pie chart to open the Hosts page filtered by that purpose. For details, see Manage hosts. |
|
Source
|
The host type distribution across all projects: Local or Cloud. Hover over a section of the pie chart to see the number of hosts that are local or provisioned from a cloud provider. Click a particular host source in the pie chart to open the Hosts page filtered by that source. For details, see Manage hosts. |
| Runs | |
| Last Finished |
Displays the most-recently completed test runs (up to a maximum of 10), including test name, project name, run state, start time, and duration of the run. The runs are ordered by the most-recently finished run, according to end time. Click |
| Currently Running |
Displays the currently running tests for all users of the project (up to a maximum of 10), including test name, project name, run state, start time, and duration of the run. The runs are ordered by the most-recently started run. Click |
| Scheduled |
Displays the tests that are scheduled to run (up to a maximum of 10). The runs are ordered by the test next scheduled to run. Click |
| Concurrent Runs | |
| Concurrent Runs (last month) |
Displays the number of concurrent test runs for all projects for the last month. To zoom in on a portion of a bar or line graph, place the mouse on the graph, hold the left mouse button down, and drag across the area of interest. Use Reset Zoom to go back to the previous view. |
| Project Limits vs Actual Use | |
| Project Limits vs Actual use (last month) |
Displays the concurrent resource usage per project and whether resources are used within the licensing limits.
For details, see Project Limit vs. Actual Use report. |


