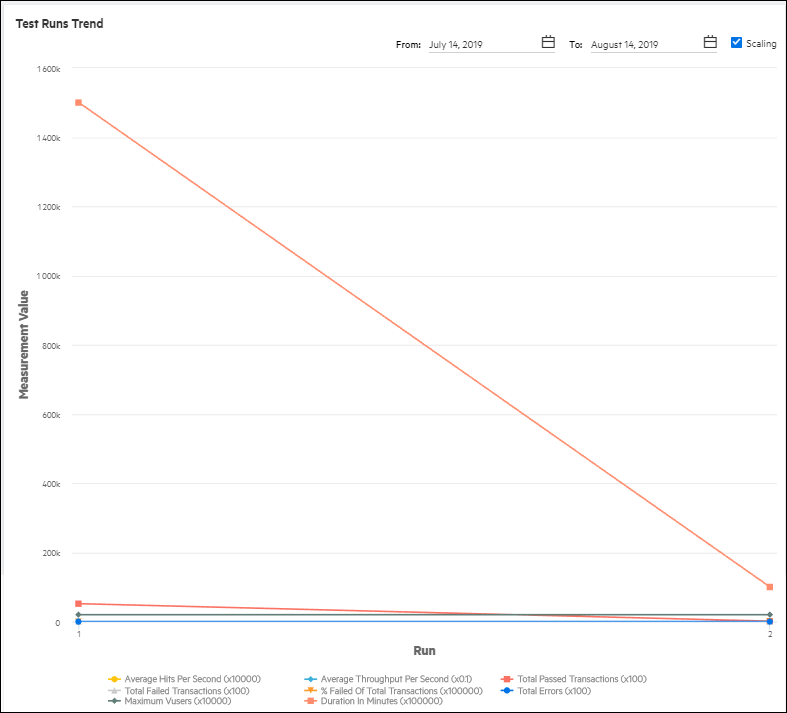
This topic describe how to display the trend graph which monitors the test runs of a selected test over time.
Open the Test Runs Trend view
This task describes how to access the trend graph.
To open the graph from Test Management tree:
-
From the LoadRunner Enterprise navigation toolbar, click
 and select Test Management (under Testing).
 -
Click a performance test in the test management tree. The Test Runs Trend graph is displayed in the lower-right pane.

To open the graph during a performance test run:
In the Performance Test Run toolbar (located in the upper area of the Performance Test Run page), click the arrow adjacent to the More button, and select Runs Trend.
For details, see Toolbar buttons.
Filter the graph display
This task describes how to filter the information displayed in the Test Runs Trend graph.
-
Click the From and To
 calendar icon and select the desired trended time frame for the graph.
 -
Select the Scaling option to automatically scale the measurements by calculating the best ratio for displaying the graph. The scaling factor is specified next to each measurement.
-
Select the desired measurement types you want to view:
Average Hits Per Second Measures the average number of hits per second within the trended time range.
Average Throughput Per Second The amount of throughput per second within the trended time range.
Total Passed Transactions The total number of passed transactions run within the trended time range.
Total Failed Transactions The total number of failed transactions run within the trended time range.
% Failed of Total Transactions The number of failed transactions out of the total number of transactions.
Total Errors The total number of errors within the trended time range.
Maximum Vusers The maximum number of running Vusers during a test run within the trended time range.
Duration in Minutes The duration of a test run in minutes within the trended time range.
The Measurement Value axis displays the value of the measurement being trended.
The Runs axis displays the number of test runs.
 See also:


