Share this page


Determine the cycle time
ALM Octane tracks cycle time for your features and work items. This topic describes how cycle time is calculated and how to work with the cycle time widgets.
In this topic:
- Cycle time overview
- Cycle time tracking
- Cycle time calculation for cycles with missing data
- Feature cycle time across releases graph
- Feature cycle time by phase across releases graph
- Feature cycle time by phase graph
Cycle time overview
An item's cycle time is defined, by default, as the number of days it took the item from In Progress to Done phase. You can customize the phases to include in the cycle time as described in ALM Octane dashboard. ALM Octane tracks this time and stores it for the cycle time widgets and graphs.
The dashboard's DevOps & Analytics graphs to help you track the cycle time for work items, such as features, quality stories, and user stories. These graphs include:
The cycle time graphs also include insight cards which provide you with additional analytics. These analytics can help you identify correlations, anomalies, trend behavior, and bottlenecks. For details, see ALM Octane insights.
Note:
- Versions of ALM Octane preceding CP5 (12.55.8) did not collect tracking data. Therefore, if items were handled in earlier versions, they will not appear in the graphs.
- Items with a cycle time of less than an hour for a specific phase, are not included in the phase's average calculation.
Cycle time tracking
This section describes how ALM Octane calculates the cycle time presented in the feature cycle graphs. ALM Octane cycle time calculation is based on the time a feature (or other work item) remained in the various phases.
The calculation of the cycle time represents how long each backlog item spent in each of its phases.
The following factors affect the cycle time calculation—the cycle time trigger, moving back and forth between phases, and calendar events.
Cycle time trigger
The trigger for calculating and storing the cycle time for each phase, is the transition out event of an item from a the phase. For example, if an item is moved from phase New to In Progress, the number of days in New is only calculated upon the phase transition. If a phase is incomplete, ALM Octane will not have precise tracking information for the cycle time.
Moving back and forth between phases
The cycle time includes a sum of all days that the feature remained in each phase. For example, if a feature was in the In Progress phase, moved to the In Testing phase, moved back to In Progress, and out again, the cycle time will include all days of the In Progress phase, even though they were not sequential in time.
In summary, the cycle time is the sum of all the days spent in each of the work item's phases.
Calendar events
Cycle time measurements do not include non-workday calendar events configured for your workspace or team. For example, if your calendar events indicate a holiday on a certain day, and a weekend on Saturday and Sunday, these days will be subtracted from the sum total of days. They will not influence the actual cycle time of the feature.
Cycle time calculation for cycles with missing data
When ALM Octane calculates cycle time in a given scope, such as a release, milestone, or sprint, it may encounter items that are missing data.
Missing data may be a result of:
-
Unfinished items, such as backlog items, that have not reached their final phase.
-
Backlog items that are missing measurements from some phases, due to the way the workflow was designed.
ALM Octane calculates the average cycle time per scope in the following manner:
-
ALM Octane considers the average for each phase across all items that have data for this phase.
-
ALM Octane sums up the average that we calculated, for each phase. This is the sum of the averages across all phases, which is also the average cycle time for the scope.
The approach used for missing data differs slightly from the standard average calculation, since the average is calculated per phase, not item.
In most instances, when the workflow and backlog items have all of the measurements for each of the phases, the standard average and the sum of the averages across all phases converge to the same value. However, in cases where data is missing, there will be a slight discrepancy between calculations made by each of the approaches.

Feature cycle time across releases graph
The Feature cycle time across releases graph is a trend graph that compares the average cycle time of multiple releases. The graph header shows, as a percentage, the increase or reduction in the average cycle time compared with earlier releases. Using this cross-release trend graph, you can see whether you are improving your development cycle with shorter cycle time for features, resulting in less time to market.
When you hover over points in the graph, a pop up provides information about the release, for example, the number of completed features, and the average story points per feature.
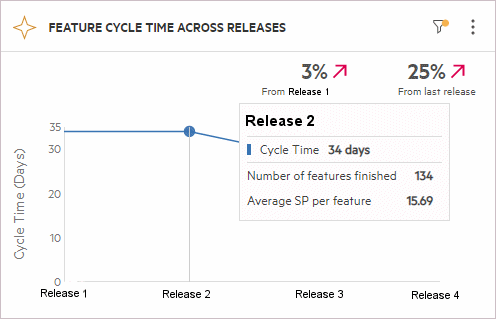
By default, cycle time refers to the time a feature was started (In Progress) until its completion (Done). In the Scope page, you can customize the start and end phases from which to measure the cycle.
Feature cycle time by phase across releases graph
The Feature cycle time by phase across releases graph is a trend graph that shows how long features remained in each phase across multiple releases. The y-axis shows the average number of days that the features remained in each phase. In the Scope page, you can indicate which phases and releases to track.
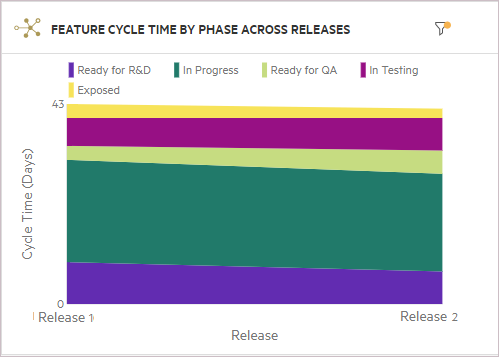
Study this graph to find patterns in the feature cycle time. This information lets you spot anomalies in the release cycle and pinpoint the problematic phases. When you hover over the different sections of the graph, the tooltips show a summary of the time periods. For example:
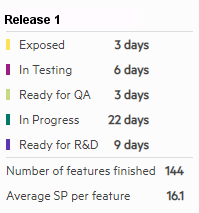
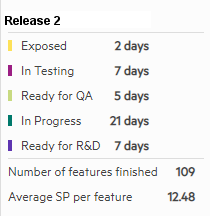
In this example, the later release shows a decrease for the In Progress phase, but an increase for the Ready for QA phase for Release 2. In the second release, the time that features waited for QA is higher, which may indicate a shortage in QA resources.
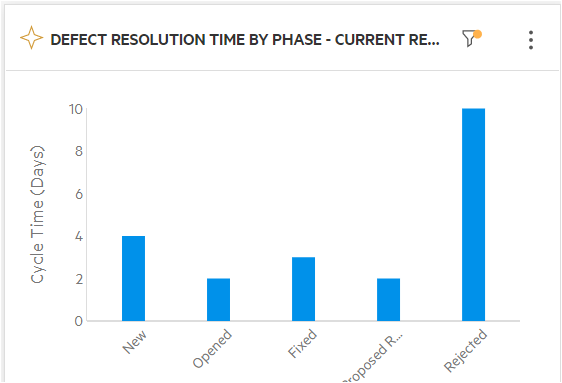
Feature cycle time by phase graph
The Feature cycle time by phase graph is not a trend graph. It is a summary graph that shows how long features remained in each phase. The y-axis shows the number of days that the features remained in each phase. In the Scope page, you can indicate which phases and releases to track.
This widget enables you to select features completed on a specific time frame (not necessary coupled to a specific release) and enables you to drill down to the cycle time of each phase in order to identify bottlenecks.
 Next steps: