Share this page


Track release progress
Use tracking tools to monitor a release's progress and quality.
Overview
Use various tools to track the release progress and analyze its quality.
| Tool | Description |
|---|---|
| Grid Timeline view |
The grid timeline view helps you gain increased visibility of a release by displaying work item phases in a Gantt chart. The timeline also displays waste time, and helps you track repeated and slow phases. For details, see Timeline view. |
| Summary widgets |
Use the summary widgets to monitor your release progress and quality. For details, see Progress column and summary widgets. |
|
Grid columns |
Add the following columns to your work items' grid:
|

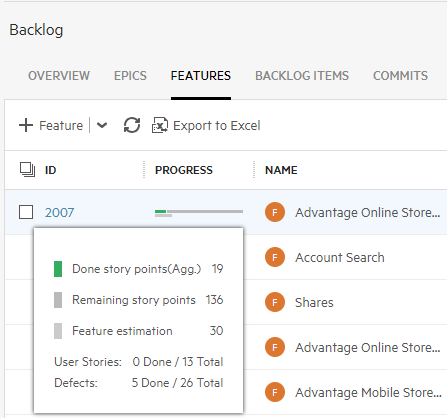
Progress column and summary widgets
Use the Progress column and summary widgets to view the item or team progress.
-
Hover over the Progress column in either the Grid or Smart List views. ALM Octane shows the progress for Epics and Features by story points, and for Backlog Items in hours.
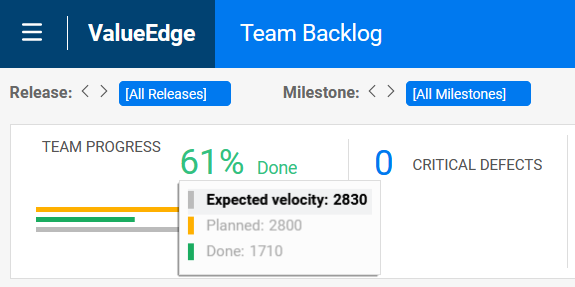
-
Track your team's progress in the summary section of the Team Backlog module.
Planning buckets
Use the planning buckets for analysis:
-
In the Backlog module, view the release progress bucket. For details, see Backlog planning buckets.
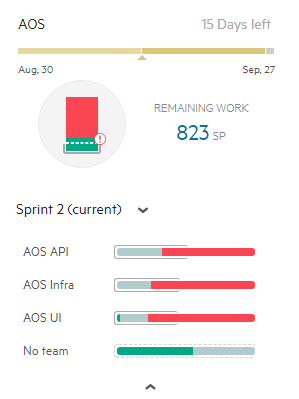
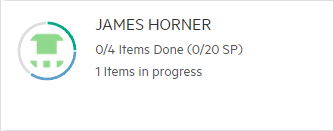
-
In the Team Backlog module, view the planning buckets for each of your team members. For details, see Team planning buckets.
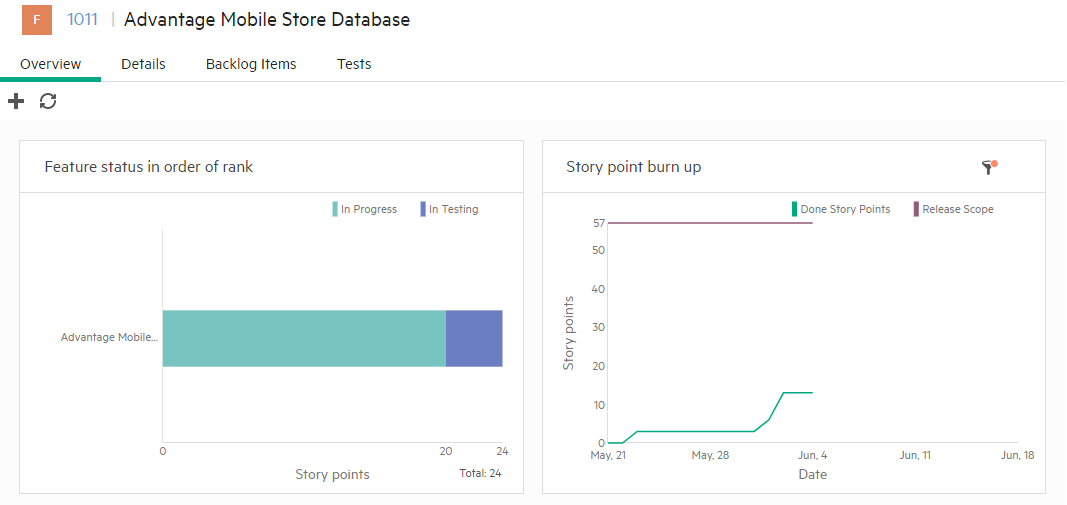
Overview tab widgets
The Backlog module's Overview tab provides a set of widgets that allow you to monitor progress and quality aspects of the release.
Use the default set of widgets, or select other widgets from the Widget Gallery. You can also design your own customized widgets. For more details, seeDashboard.
The scope of the widgets in the Overview tab is set by the context filters at the top of the page, and by the epic or feature selected in the Backlog tree.
Further filter the widget data using the Filter categories in the right pane.
The Runs in Release and Runs in Milestone filters in the right pane impact only test and test run widgets.
Release forecast widget
You can view your release's forecast progress by adding the Release forecast widget to your Dashboard. The widget displays a line with the forecast progress of user stories or defects through the end of the selected release.
The widget also includes details on the release, including finished story points and expected completion. For details, see Dashboard widgets.
 See also: