Share this page


Capacity planning
When the budget
Analyze capacity utilization
What-if analysis provides the Budget Remaining constraint indicator to assess budget utilization.
Tip: Use the predefined Product Roadmap Planning View layout template, which includes the
To analyze capacity utilization:
-
Open a scenario's details page.
-
Select a layout template with the Budget Remainingindicator.
-
Review the Budget Remaining table to see how much budget remains after being allocated to moved-in items in the scenario.
-
To view a detailed breakdown of capacity and demand for budget, click the down arrow next to Budget Remaining.
Budget capaicy, demand, and remaining calculations
| Data | Calculation |
|---|---|
| Capacity for each period |
The period type is configured in the layout template settings. For details, see Period Type Setting. |
| Demand for each period |
|
| Budget remaining |
Calculated by subtracting the demand of each period from the capacity of each period. |

Reschedule items
If some periods show negative budget remaining values but some periods show positive values, you can try shifting the start dates of some items instead of increasing the capacity.
To shift start date:
Tip: To reschedule scenario items, use a layout template with Board View or Hierarchy Gantt View. Use predefined templates like
-
Open a scenario's details page.
-
Select a layout template with Board View or Hierarchy Gantt View.
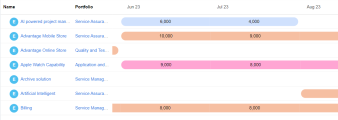
Items whose time periods falling within the scenario time period are displayed as Gantt charts. The Gantts can display
Curved lines on the left of the Gantt indicate that items start earlier than the scenario's start period; while curved lines on the left indicate that items finish later than the scenario's end period.
-
To start an item earlier, drag the Gantt chart leftward. To postpone it to a later time, drag the Gantt chart rightward. The original time period is displayed in a lighter shade.
-
(Optional) When rescheduling, a color change in the dependency icon indicates a dependency violation. Hover over the icon to view the details and make the necessary adjustments. For details, see View dependencies.
-
Click Save to save the changes made to the scenario.
-
If you want to discard time period changes made to the scenario, click Restore.

Apply time period changes to portfolio
If rescheduling reduces the capacity-demand gap, you can apply these changes to the portfolio.
To apply schedule changes to portfolio:
-
Open a scenario's details page.
-
Click Apply at the top of the page.
-
Review the proposed time period changes in the Time Period Changes area.
-
Select the portfolio contents for which you want to apply the new time periods.
-
Click Apply.
 See also: