Share this page


The Micro Focus Connect dashboard
This topic describes the Micro Focus Connect main page, known as its dashboard.
Dashboard tabs
When you log into Micro Focus Connect, the main dashboard opens with default columns.
The dashboard contain the following tabs:
| Tab name | Description | Learn more |
|---|---|---|
| Connections |
Information about the connections:
The Connection Details panel displays further information about the currently selected connection. For details, see Connection Details pane. |
Connection Details pane |
| Servers | A list of servers currently hosting Micro Focus Connect instances. This tab is only visible for users with a Site security role. | Servers tab |
| Data Sources |
Displays a list of currently defined data sources. The Data Source Details panel shows detailed information for the currently selected Data Source. The information displayed on this panel varies based on the data source. You can also use this page to create and edit Data Sources. A data source provides information about how Micro Focus Connect can communicate with a third-party repository/tool (for example: Jira). |
Create a data source |
| User Maps |
A list of the user maps defined for the connections. From this tab, you add and manage user maps. User maps define users that have different user names across multiple data sources. For example, a user may be User1 in one Data Source and User 1 (with a space) in another. User maps allow you to map these two users together so that Micro Focus Connect knows they are the same user. |
User maps and user matching |
| Authenticators | A list of authenticators defined for Micro Focus Connect. From this tab, you can define and edit authenticators. | Add an authenticator provider |
| Users | A list of users authorized to log in to Micro Focus Connect. Use this tab to manage how users log in to Micro Focus Connect. | Manage users |
 indicates a
bi-directional synchronization.
indicates a
bi-directional synchronization.
Manage columns
Dashboard tabs, both in the primary pane and the secondary pane, such as the Connection Details pane, display default columns.
To customize the columns that are shown:
-
Click on a column name and expand the downward arrow, to the right of the name.
-
Choose Columns and select all the columns that you want to show. Clear the checkbox for columns that you want to hide.
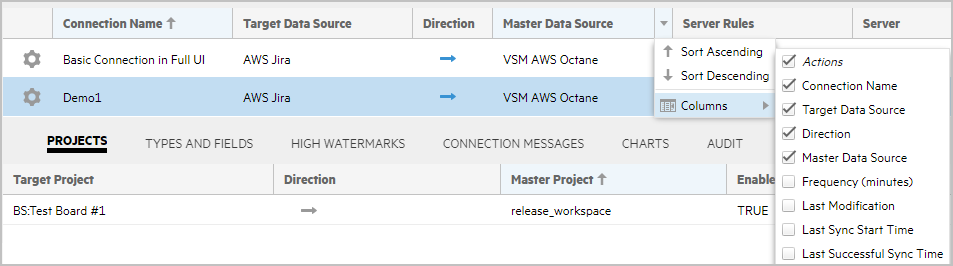
To order a column by ascending or descending values:
-
Click on a column name and expand the downward arrow, to the right of the name.
-
Select Sort Ascending or Sort Descending.
Dashboard toolbar
The Micro Focus Connect dashboard toolbar contains the following buttons:
| Button | Description |
|---|---|
| Uptime <timestamp> | An indication of how long the instance of Micro Focus Connect has been active in days, hours, and minutes. |

|
Provides access to the following menu items:
|

|
Provides the following links:
|

|
Allows you to change your password or log out of Micro Focus Connect.
|
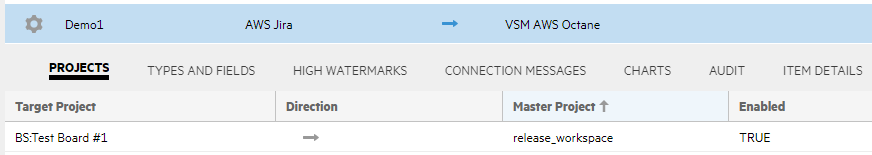
Connection Details pane
When you select a connection in the dashboard's Connections tab, the lower pane displays tabs with the connection details.
The following table describes the tabs in the Connection Details pane:
| Tab name | Description | Learn more |
|---|---|---|
| Projects |
The selected connection's project information:
|
Add projects and rules to a connection |
| Types and Fields | A list of the types included in the synchronization, for both the master and target with the synchronization direction. Expand a type entry to view its fields and mappings. | Type mapping |
| High Watermarks |
A list of the watermarks per type set and project set, for each source and target. Watermarks indicate what was already synchronized. Expand a type set to view its associated watermarks. |
Reset watermarks |
| Connection Messages |
A list of the messages issued by Micro Focus Connect for the selected connection. These messages provide:
|
User maps and user matching |
| Charts | Charts with information relating to the activity in the selected connection, as a function of the iteration time. | Charts |
| Audit |
Insights into items that were created or updated during a connection run for the selected connection. For details, see Audits. |
Troubleshooting |
| Item Details |
The cross reference item details for the selected project and type maps, between the source and destination. and their current stat. It also allows you to see the last error that was captured. To display the item details, choose a project and type map using the dropdowns. The item details include the current state of the relation such as associated, updated, or error, and the last captured error. Tip: Set additional filters, such as date range, item id, and the cross reference state. After you set the filters and configure the display, click Run to display the results. By default, the following columns are displayed: State, Last Error Message, Source item id, and Target Item id. |
Troubleshooting |
Audits
When a synchronization runs, it produces a report called an audit. Audit reports contain records of the items synchronized during an iteration, including successful operations (adds, updates) and failures, along with details and item counts.
Audit reports can be generated on-demand or scheduled as part of a nightly batch. For details, see the Audit script batch script.
To display audit information, define a filter using the dropdowns: date range, project name, type name, operation type, Item ID, field name, and field value.
After you set the filters:
-
Click Run to generate an audit query.
-
Click Graph/Tree to toggle the display of the results in a graph or tree form.
If an error occurred, the audit includes the failure cause and stack trace (if the trace level is enabled). In most cases, these messages are errors returned by the product in the connection, for example, Jira or ALM Octane.
Note: Micro Focus Connect cleans up all logs and audit reports every 24 hours. The older records are saved as .csv files. On-premises users can delete these file manually. SaaS users can configure the system to remove these files at a given interval. The Audit tab only shows the data since the last purge.
The following are some of the audit report features:
- Audit report outputs are generated in a CR/LF line separated format, “|” as a column delimiter, with a .txt extension.
- The output can be exported to a spreadsheet or any SQL database.
- If SMTP is configured, the audit can be emailed to server-wide recipients.
- Audit reports can be extracted for one or multiple connections.
-
If you purge the database at regular intervals, the Audit tab only shows the data since the last purge. Older audit data is exported into a file by the Purge scripts, and saved in the backup folder.
Tip: Make sure to purge the audit data on a regular basis. Failure to do so, may result in a disproportionately large AppData/data folder that retains all unpurged audit information in the Micro Focus Connect service memory. For details, see Purge files on Windows as a nightly task.
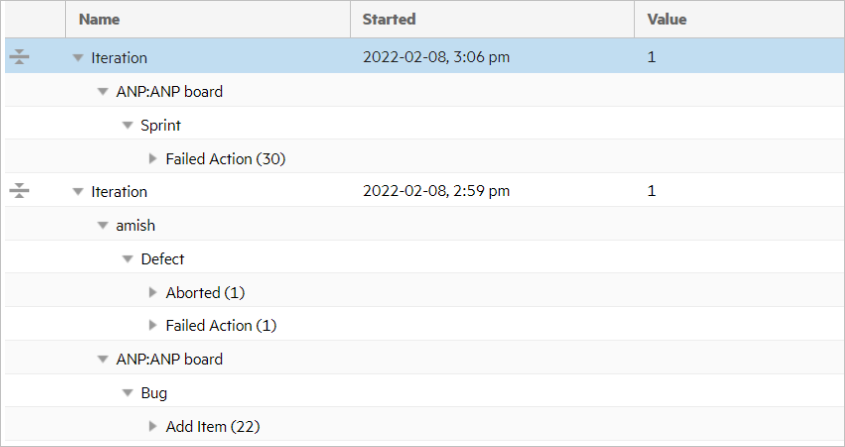
Sample audit report
The following example shows the information included in a typical audit report.
 Next steps: