Run Log Viewer IntelliJ Plugin
The Run log viewer plugin provides a view to messages processed by running virtual lab. It can be installed from the JetBrains plugin repository.
Plugin configuration
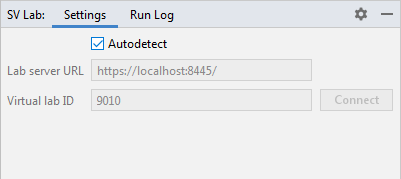
The Settings tab of the plugin enables you to switch between the autodetect mode and manual mode.
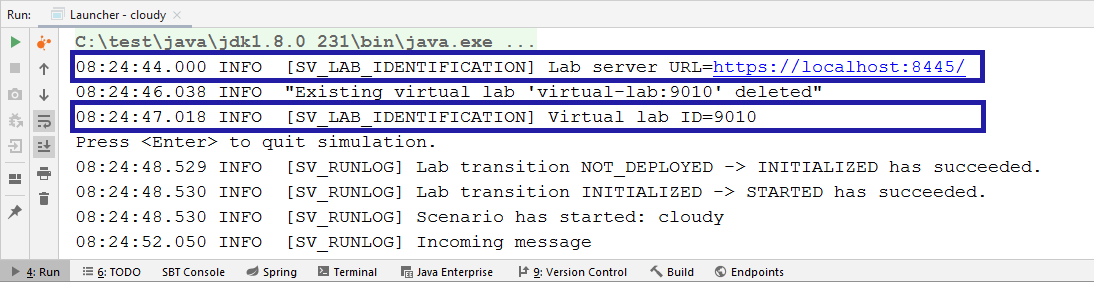
The autodetect mode is useful when you are running a Java test or application
that deploys a virtual lab. In autodetect mode, the plugin injects the
-Dsv.client.lab.info=INFO property into the run configuration being launched
that enables console output of the current Lab Server URL and virtual lab ID (tagged
with [SV_LAB_IDENTIFICATION]):
The plugin then displays the run log whenever a virtual lab is being initialized.
In manual mode, the viewer connects to the Lab server at the specified URL
and displays the selected virtual lab. The default URL is https://localhost:8445 and
the default virtual lab ID is 9000.
Run log display
The run log view consists of the left message list pane and the message detail pane on the right.
Message list
The left pane shows a list of events in the run log:
- scenario start events
- incoming and outgoing messages
Each start of an application scenario is shown in a gray row with a star:
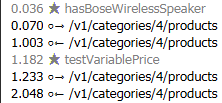
The left column shows a timestamp of the elapsed time since the lab start, in seconds with a millisecond resolution. The pictogram to the left of an operation identifier denotes the message type. The small circle denotes the virtual service and the arrow denotes the communication direction. The requests to, and responses from, a virtual service in the SIMULATE_SERVICE mode appear as follows:

The following is an example of a request from, and response to, a virtual service in the INVOKE_REAL_SERVICE mode:
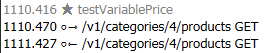
Only an arrow is shown on messages forwarded to or from a real service (that is, during learning) when the virtual service is in the FORWARD_TO_REAL_SERVICE mode:

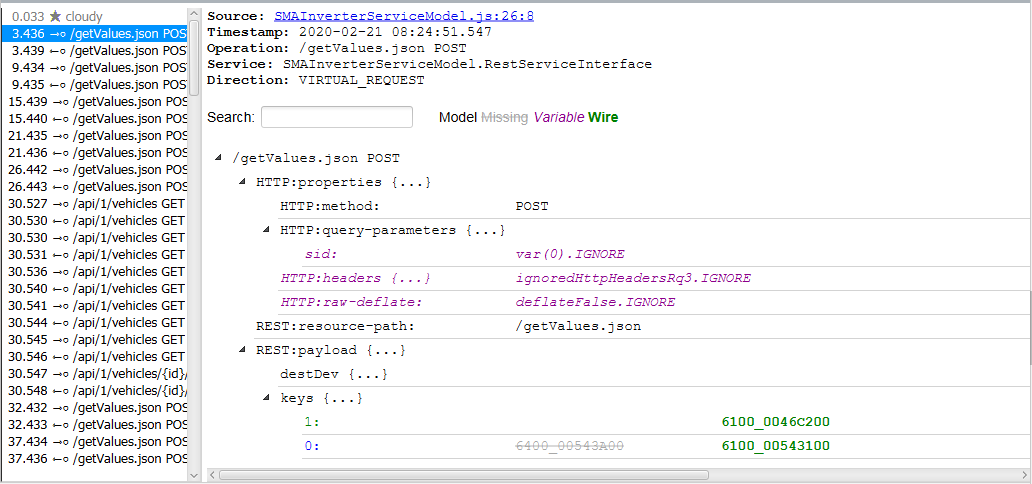
Message detail
The right pane shows message metadata above the structured message content display:
Tip
You can click source link to navigate to the message definition in the service model. The navigation works by matching the file name of the service model, so the file name must be unique in the scope of your IntelliJ IDEA project.
The structured message data uses a color code to show the difference between the model message and an actual received message:
- The model values matching the received message are black.
- The model values missing in the received message are gray.
- The values present in the received message that are not in the model are green.
- The variables ignored during simulation are magenta.
To copy a value to your clipboard, hover over it with your mouse and click the clipboard icon.
Troubleshooting
If the run log viewer appears to display incorrect information, refresh the view from the context menu.