Create trend reports
LoadRunner Enterprise trend reports enable you to compare performance test run data over time, thereby giving you better visibility and control of your application's performance.
Overview
A trend report is a feature that allows you to view changes in performance from one performance test to another, or across several performance tests. By analyzing these changes, you can easily identify improvements or regressions in the measurement’s performance.
You can define a trend report, or you can configure automatic trending. Automatic trending makes the process simpler and more efficient by automating the collate, analyze, or publish steps, so that you do not have to wait for each of these steps to finish before continuing with the next one.
Select a comparison method to identify trends
By comparing the same measurement in more than one instance of a test run, you can identify whether its performance trend is improving or regressing.
For example, if you were interested in the performance trend of the transaction response time measurement, the trend report clearly displays whether over several instances of a test run, this value has increased or decreased from one run to another - a performance regression or improvement respectively.
There are two methods of comparing measurements contained in a performance test run for the purposes of identifying performance trends: Compare to Baseline and Compare to Previous.
|
Comparison Method |
Description |
|---|---|
|
Compare to Baseline |
You select one performance test run in the trend report and define it as the baseline. All measurements in the report are then compared to the measurements contained in the baseline.
|
|
Compare to Previous |
All measurements in a performance test are compared to the measurements in the performance test run that immediately precedes it in the report.
|
It is important to understand the difference between the two comparison methods. The following example will illustrate how the same data can yield different results depending on the method you select.
As shown in the image below, the average Transaction Response Time measurement is being trended from four performance test runs: 3, 4, 5, and 6.
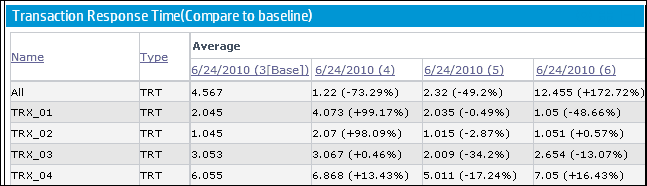
Performance test run (PT) 3 has been defined as the baseline (as indicated by the word Base in parentheses). The average transaction response times contained in the other performance test runs are compared to PT 3 only.
In PT 3, the average transaction response time for TRX_01 was 2.045. The average transaction response time for the same transaction in PT 5 was 2.035, which represents a slightly faster response time and therefore a slight improvement in the performance of this measurement. The percentage difference between the two figures is displayed in brackets, in this case -0.49%.
However, if the Compare to Previous comparison method was selected, then the average transaction response time in PT 5 would be compared not to PT 3, but rather to PT 4 (since 4 precedes it in the table). The value for PT 4 is 4.073 while for PT 5 it's 2.035, a percentage difference of -50.04%.
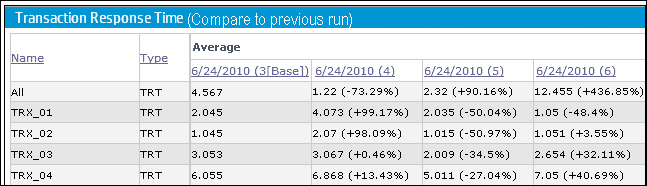
Using exactly the same data, the two comparison methods have yielded very different results. Only a slight improvement with the Compare to Baseline method (-0.49%), while a more significant improvement with the Compare to Previous method (-50.04%).

Define trend thresholds
To identify significant improvements or regressions in performance, you can define unique thresholds to track differentials between measurements being compared. If a differential exceeds a defined threshold, that value appears in a predetermined color, identifying it as an improvement, minor regression, or major regression.
For example, if you define an improvement threshold for comparing transaction response times as 50%, then any transaction response time that is 50% lower than that of the baseline or previous run (depending on the comparison method) will appear in the color you defined for improvements.
In the example below, the following performance thresholds for the transaction response time (TRT) measurement have been defined:
-
Improvement. At least 90% decrease
-
Major Regression. At least 50% increase
These threshold definitions mean that any performance improvements or regressions which exceeds these percentages will be displayed in color, making them more identifiable.
In the following table, the Compare to Previous comparison method is used.
In the table above, we see that the value of the TRT measurement for the Action_Transaction in performance test run 4 is 46900% higher than in performance test run 3 - a performance regression which far exceeds the defined threshold for major regressions. Therefore, the value appears in red, the default color for major regressions.
The corresponding value for performance test run 5 represents a 100% improvement on performance test run 4. Since this percentage exceeds the defined threshold for improvements, the value appears in green, the default color for improvements.
Map custom measurements
The Custom Measurement Mapping feature allows you to reconcile inconsistent transaction or monitor names between performance test runs, thereby allowing you to properly trend these measurements.
The following are two examples of when you would use the Custom Measurement Mapping feature:
You run a performance test that contains the transaction BuyBook. A while later you run the performance test again. However, in the time between the two performance test runs, the transaction name has been changed to TRX_01_BuyBook.
As a result of this inconsistent naming, you cannot obtain any trending information for this measurement, as LoadRunner Enterprise cannot recognize that the two transactions are actually the same, and compare them for trending purposes.
To overcome this problem, you map the two measurements (BuyBook and TRX_01_BuyBook) to a new third measurement which you create, for example Buy_Book_mapped. You add this new user-defined measurement to the trend report. LoadRunner Enterprise can then compare two instances of the Buy_Book_mapped transaction and give you meaningful trending information.
You can give the new transaction the same name as one of the current transactions. Additionally, you can configure the mapping so that all future instances of the transaction are automatically mapped to the new transaction name.
You want to compare your application's performance when it runs on different operating systems or when it runs on different Web/application servers.
You run the performance test once on a Windows platform, and then again on a Linux platform. You then want to compare the CPU utilization between the two runs. However, each platform provides a different name for this measurement. For example, % Processor Time (Processor_Total) in Windows, and CPU Utilization in Linux.
LoadRunner Enterprise cannot successfully obtain trending information for this measurement because the measurement names may be different.
To overcome this problem, you map the two measurements (% Processor Time (Processor_Total) and CPU Utilization) to a third measurement which you create, for example CPU_mapped. You then add this new user-defined measurement to the trend report. LoadRunner Enterprise can then compare the two instances of the CPU_mapped transaction and give you meaningful trending information.
You can give the new monitor the same name as one of the current monitors. Additionally, you can configure the mapping so that all future instances of the monitor are automatically mapped to the new monitor name.
Define a trend report
Before a performance test can be trended, the run must be collated and analyzed in order to be added to a trend report. If the run is collated only, the system automatically analyzes it before adding to a trend report. If the run is not collated, it will not be automatically analyzed and trended.
-
Open the Performance Trending page
From the LoadRunner Enterprise navigation toolbar, click
 and select Performance Trending (under Analysis).
 -
Define a new trend report
-
On the Performance Trending page, click
 New Trend Report.
 -
Define the basic trend report by defining its name, description and selecting a template. For user interface details, see Create New Trend Report page.
-
Click Create to create the new report.
-
-
Add performance test run data to the report
-
In the Select Test Runs to Trend Report dialog box, select Project, Test Set and Test. All analyzed instances of the performance test appear in the grid. For user interface details, see Select Test Runs to Trend Report dialog box.
-
Select those analyzed instances of the test that you want to add to the trend report, and click Add.
LoadRunner Enterprise uploads the test runs from Analysis and adds them to the trend report. The trend report opens displaying the Trend Overview tab. For user interface details, see Trend Overview tab.
-
-
View trend report data
-
In the Trend Overview tab, you can view and manage the test runs trended in the report. For user interface details, see Trend Overview tab.
-
View and manage other trend views. For user interface details, see Trend Report <Report Name>.
-
Configure automatic trending
Automatic trending enables you to publish trend reports automatically without having to manually run the collate, analyze, and publish process. Automatic trending can only be configured on a per-test basis, not per-run.
Configure automatic trending using the LoadRunner Enterprise user interface
-
Select a performance test in the test management tree and click Edit Test.
-
In the Performance Test Designer window, click the dropdown arrow adjacent to Trending in the Summary pane, and select Create Automatic Trending to configure trend settings for a test (by default, Trending settings are Off).
-
Enter a name for the trend report, and configure trend settings for a test. LoadRunner Enterprise uses these settings to automatically publish trend results without you having to manually run the collate, analyze, or publish process. For details, see Trend Settings dialog box.
-
In the Performance Test Designer window, click the
 Select Automatic Trending Options button adjacent to the Trending box to configure trend settings for a test.
 -
In the Trend Settings dialog box, select Create Automatic Trending, and select a report to which to add the performance test run data or create a new report.
-
Select the range to include in the trend report in Trend Range.
-
Enter the maximum number of runs to publish in the report, and the action to take after this number has been reached. For more details, see Trend Settings dialog box.
Trends are automatically added to the trend report when the automatic trend task runs. Test runs that require analysis are added after an additional run cycle.
-
Click OK. Automatic trending is enabled for the test, and Trending is displayed as On in the Summary pane.
Configure automatic trending using REST API
You can configure automatic trending using the LoadRunner Enterprise REST API. For details, see test entity XML.
Measurement acronyms
The following table lists all the measurement acronyms that might be used in the trend report:
|
Data Type |
Full Name |
Initials |
|---|---|---|
|
Vusers |
Running Vusers |
VU |
|
Errors |
Errors |
ERR |
|
Transactions |
Transaction Response Time |
TRT |
|
Transaction Per Second |
TPS |
|
|
Transaction Summary |
TRS |
|
|
Web Resources |
Hits per Second Throughput Connections |
WEB |
|
User Defined Data Points |
User Defined Data Points |
UDP |
|
System Resources |
Windows Resources |
WIN |
|
UNIX Resources |
UNX |
|
|
Server Resources |
SRVR |
|
|
SNMP |
SNMP |
|
|
SiteScope |
SiS |
|
|
Web Server Resources |
Apache |
APA |
|
MS IIS |
IIS |
|
|
Web Application Server Resources |
MS ASP |
ASP |
|
Database Server Resources |
Oracle |
ORA |
|
MS SQL |
SQL |
|
|
J2EE |
Server Request |
J2EE |
|
.NET |
Server Request |
NET |
|
Additional Components |
COM+ |
COM |
|
.NET |
NET |
|
|
Application Deployment Solution |
Citrix MetaFrame XP |
CTRX |
 See also: