Performance Application Lifecycle (PAL)
This topic describes the Performance Application Lifecycle (PAL) solution for end-to-end testing.
Note: The PAL feature is not available in this release of LoadRunner Enterprise.
About PAL
Performance Application Lifecycle (PAL) allows for complete end-to-end testing and DevOps feedback. Users can accurately compare performance test results with real production data benchmarks. Analysis of these results provides a framework to assist you in creating performance test scenarios to resemble realistic environments as closely as possible, which reduces test assumptions and risks.
PAL enables you to use user traffic and system monitoring data in production to design a performance test that closely resembles production behavior. You can import production data from Microsoft IIS W3C Extended Log Format (IIS W3C), Apache, and Micro Focus Real User Monitor (RUM).
PAL’s importance stems from the basic need to correctly plan testing initiatives. Without a clear understanding of what users are doing in production, and how the production system behaves, it is very difficult to:
- focus testing on the most widely used business cases and scenarios
- test the system under appropriate loads
- define testing targets (for example, Service Level Agreements)

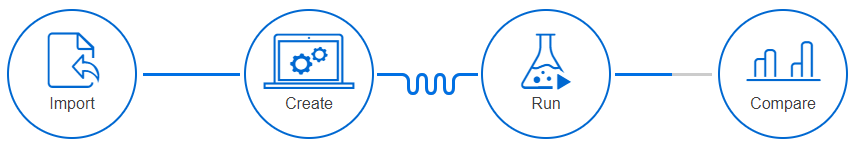
PAL workflow
The PAL flow includes the following main steps:
|
Step |
Description |
|---|---|
| Import | Import a data set from a production system. Different production monitoring systems provide different data which may influence which information is available to the user. |
| Create |
After uploading your data set to LoadRunner Enterprise, it analyzes the data and creates a PAL scenario with business flows. You can translate each business flow into a script. If a flow has no significance, you can exclude it from your script. After you are done translating your business flows to scripts, you create your performance test and assign to it your scripts. |
| Run |
Run your performance test. |
| Compare | Compare performance test results with your production data. If necessary, readjust and rerun your test. |
Create a testing environment using PAL
This task describes how to create a testing environment similar to your real production environment using PAL.
-
Prerequisites
Create a data set based on production data benchmarks.
For information on how to create data sets using IIS W3C, Google Analytics, Webtrends, Apache, or RUM, see Create PAL data sets.
For information on how to create APM data sets, see Create PAL data sets from APM.
-
Open PAL
From the LoadRunner Enterprise navigation toolbar, click
 and select PAL (under Analysis).
 You can also open a PAL production report in the Performance Test Designer by selecting a performance test in the test management tree and clicking Edit Test. In the Performance Test Designer window, select Groups and Workload > More > PAL Report.
-
Import production data
- In the Data Set tab, select a data set folder and click Import. The Upload Production Data Set Dialog Box opens. For user interface details, see Upload Production Data Set dialog box.
-
Upload the data set file. The data file is stored as a .zip file.
-
Create the scenario analysis
- Start scenario analysis.
In the Data Set tab, select your data set.
In the Scenario tab, click Start Scenario Analysis. PAL samples the data set and displays a suggested scenario.
Note: Scenario Analysis supports the following data set types: IIS W3C, Apache, and RUM.
To analyze Google Analytics, Webtrends and BSM data sets, create a PAL report. For details, see the Run the performance test step.
-
Adjust your scenario.
Review your business flows and adjust your coverage as needed. For user interface details, see Data Sets - Scenario Sub-tab.
- Assign business flows to scripts.
- To assign a business flow to an existing script, hover over it and click
 . The Assign Script dialog box opens. Select a script and click OK.
 To assign a business flow to a new script, hover over it and click
 to download a template script. Edit the script in VuGen and upload it to LoadRunner Enterprise. For more details on editing scripts, see the Virtual User Generator Help Center. For more details on uploading scripts, see Scripts.
In PAL, select the business flow to assign it to your new script, click
. The Assign Script dialog box opens. Select a script and click OK.- To hide a business flow, hover over it and click Hide
 .
. - To display a hidden business flow, hover over it and click Show
 .
.
- To assign a business flow to an existing script, hover over it and click
- Include virtual locations in the performance test - optional (available only in RUM data sets).
- Click Options. For user interface details, see Data Sets - Scenario Sub-tab.
- In the Location tab, select Include locations as part of the test. For more details on working with NV, see Network Virtualization.
- Create the performance test.
- In the Scenario tab, click Create Test to create a performance test. The Create Test dialog box opens. For user interface details, see Create a test.
- In the Performance Test Designer window, define the performance test. For details, see Performance Test Designer.
- Start scenario analysis.
-
In the Performance Test Designer window, click Run Test. The Run dialog box opens. For details, see Run a test.
-
-
Click the Reports tab and select a PAL report. For user interface details, see <Report Name> PAL report.
Note: When creating a scenario analysis, PAL automatically creates a PAL report.
For Google Analytics, Webtrends and BSM data sets, click New PAL Report. The Create New Performance Application Lifecycle Report Dialog Box opens. For user interface details, see Create New Performance Application Lifecycle Report dialog box.
- Click Add Testing Data to add the test run data to the report. For user interface details, see Data Sources tab.
- Click the report sub-tabs to view and compare production and performance test behavior. For user interface details, see PAL report view tabs.
-
Based on your comparison, you can adjust your performance test to closely resemble your production and rerun your test.
-
-
Export the test run data
- Open the Test Run Pane. For user interface details, see Manage test results.
- View the result information for the selected test run.
- To export your test run data, click Export PAL Data
 . For user interface details, see Export PAL Data dialog box.
Create PAL data sets
This task describes how to create the following data sets: IIS W3C, Apache, RUM, Google Analytics, and Webtrends.
This task describes how to create IIS W3C data sets.
-
Create log files
- Open the Internet Information Services (IIS) Manager window.
- Under Connections, select a Website (not a virtual directory).
- In the right pane, select Logging.
- In the Log File section, under Format, verify that W3C is selected.
- Click the Select Fields button and select the following fields: Date, Time, Client IP Address, ServerName, Server IP Address, Server Port, Method, URI Stem, URI Query, ProtocolStatus, Time Taken, Host, UserAgent, Cookie, and Referer.
- Under Directory, set the directory location for storing the logs.
-
Create the IIS data set file
Open the PAL Data Set Creator wizard to create the IIS data set file. For user interface details, see PAL Data Set Creator wizard.
This task describes how to create Apache data sets.
-
Configure the Apache log parameters
- To edit the Apache log configuration file, navigate to
<apache_install_folder>\conf\httpd.conf. -
Under LogFormat, define you configuration.
The section should contain the following parameters:
%t%Tor%D%{Cookie}i or %{your_cookie_name}C
Typical configuration example:
%h %l %u %t %T \"%{Cookie}i\" \"%{Set-Cookie}o\" \"%r\" %>s %b \"%{Referer}i\" \"%{User-Agent}i\" -
To complete the configuration process, restart the Apache service.
- To edit the Apache log configuration file, navigate to
-
Create the Apache data set file
Open the PAL Data Set Creator wizard to create the Apache data set file. For user interface details, see PAL Data Set Creator wizard.
The RUM data export file is located in: <install dir>\conf\datapublisher\pc_integration.xml.
The data export file defines the default output folder (C:\RUM_Export\pc_integration) and the maximum default folder size (2 Gb) among other information.
For information about the RUM data export function, see the Real User Monitor Administration Guide.
-
Copy the data export configuration file from
<install dir>\conf\datapublisher\pc_integration.xmlto
<install dir>\conf\datapublisher\consumers\pc_integration.xml -
From the RUM web console, click Tools > Monitoring configuration information.
-
Click Sync all configuration.
-
Create the RUM data set file
Open the PAL Data Set Creator wizard to create the RUM data set file. For user interface details, see PAL Data Set Creator wizard.
Create data sets from Google Analytics
This task describes how to create Google Analytics data sets.
-
Create a new custom report
- From Google Analytics, click the Customization tab.
- Click the New Custom Report button.
- Add a title name.
- In the Type section, select Flat Table.
- In the Dimensions section, add Time > Hour of Day.
- In the Metric Groups section, add Users > Pageviews.
- In the Views section, select Web sites.
- Click Save.
-
Export the report
Open the report, and select Export > CSV.
-
Create the Google Analytics data set file
Open the PAL Data Set Creator wizard to create the Google Analytics data set file. For user interface details, see PAL Data Set Creator wizard.
Open the PAL Data Set Creator wizard to create the Webtrends data set file. For user interface details, see PAL Data Set Creator wizard.
Create PAL data sets from APM
This task describes how to create and export a .zip file of application related data and monitoring tools configuration (such as actions, transactions, load, traffic, RUM topology, and SiteScope monitors) from Application Performance Management (previously known as Business Service Management or BSM) to LoadRunner Enterprise.
You export the data for a specific application and for a selected time range. If the time range you select is greater than one hour, Application Performance Management (APM) calculates the busiest hour within the selected time range (based on the number of actions) and exports the data for that one hour period only. The data is exported to a number of different files, contained in a .zip file with the default name of <selected application name>_<selected start date and time>_<selected end date and time>.zip.
For more details on creating data sets from APM, see the APM Application Administration Guide.
-
Open APM
Select Admin > Integrations > Application Lifecycle Management Integration > Export to ALM.
-
Define a filter
Select the required time frame from the View drop-down list. If you select the custom view, configure the From and To dates and times.
-
Select an application
Select the application for which you want to export data. In the list of applications, only HTTP Web based applications and applications monitored by SiteScope are enabled for data export.
Note: You can only select a single application for data export.
-
Select an export method
Select whether you want to download or send zip file by email. Click Generate.